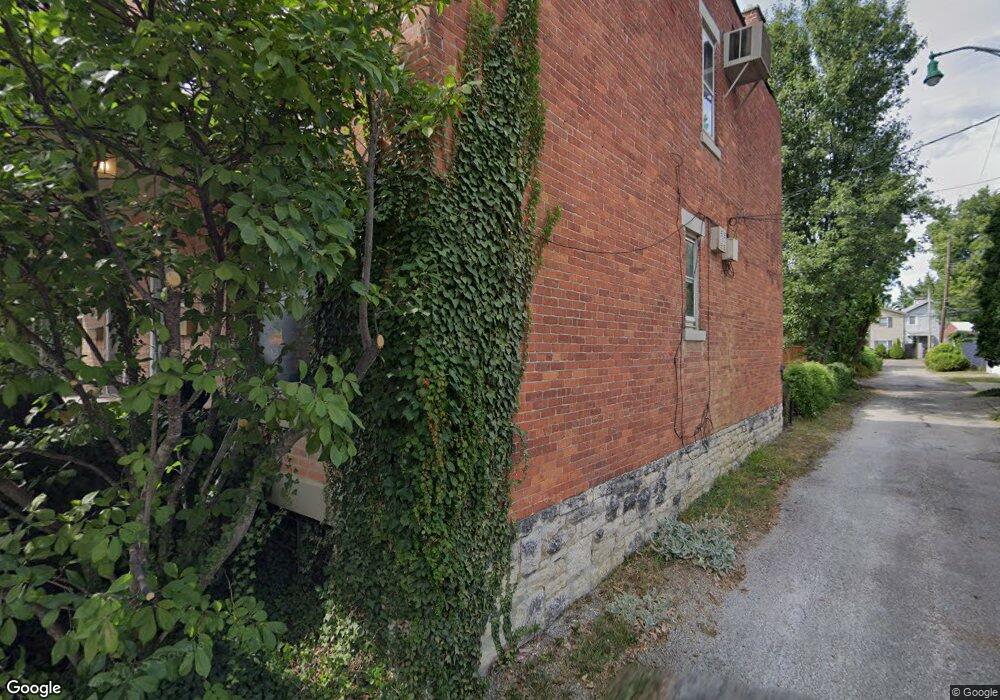
310 E Columbus St Unit 314 Columbus, OH 43206
German Village NeighborhoodEstimated Value: $614,000 - $955,000
6
Beds
3
Baths
3,600
Sq Ft
$221/Sq Ft
Est. Value
About This Home
This home is located at 310 E Columbus St Unit 314, Columbus, OH 43206 and is currently estimated at $796,333, approximately $221 per square foot. 310 E Columbus St Unit 314 is a home located in Franklin County with nearby schools including Siebert Elementary School, South High School, and South Columbus Preparatory Academy.
Ownership History
Date
Name
Owned For
Owner Type
Purchase Details
Closed on
Oct 7, 1997
Sold by
Loving June E
Bought by
Loving June E
Current Estimated Value
Home Financials for this Owner
Home Financials are based on the most recent Mortgage that was taken out on this home.
Original Mortgage
$195,000
Interest Rate
9.74%
Purchase Details
Closed on
Jan 31, 1995
Sold by
Larnn Investments
Bought by
June E Loving Trustee
Home Financials for this Owner
Home Financials are based on the most recent Mortgage that was taken out on this home.
Original Mortgage
$145,000
Interest Rate
9.28%
Mortgage Type
New Conventional
Create a Home Valuation Report for This Property
The Home Valuation Report is an in-depth analysis detailing your home's value as well as a comparison with similar homes in the area
Home Values in the Area
Average Home Value in this Area
Purchase History
| Date | Buyer | Sale Price | Title Company |
|---|---|---|---|
| Loving June E | -- | Chelsea Title Agency | |
| June E Loving Trustee | $146,250 | -- |
Source: Public Records
Mortgage History
| Date | Status | Borrower | Loan Amount |
|---|---|---|---|
| Previous Owner | Loving June E | $195,000 | |
| Previous Owner | June E Loving Trustee | $145,000 |
Source: Public Records
Tax History Compared to Growth
Tax History
| Year | Tax Paid | Tax Assessment Tax Assessment Total Assessment is a certain percentage of the fair market value that is determined by local assessors to be the total taxable value of land and additions on the property. | Land | Improvement |
|---|---|---|---|---|
| 2024 | $10,469 | $228,450 | $117,710 | $110,740 |
| 2023 | $10,339 | $228,445 | $117,705 | $110,740 |
| 2022 | $9,497 | $175,880 | $63,600 | $112,280 |
| 2021 | $9,513 | $175,880 | $63,600 | $112,280 |
| 2020 | $9,527 | $175,880 | $63,600 | $112,280 |
| 2019 | $9,565 | $151,410 | $55,300 | $96,110 |
| 2018 | $8,658 | $151,410 | $55,300 | $96,110 |
| 2017 | $8,994 | $151,410 | $55,300 | $96,110 |
| 2016 | $8,525 | $124,750 | $31,470 | $93,280 |
| 2015 | $7,766 | $124,750 | $31,470 | $93,280 |
| 2014 | $7,735 | $124,750 | $31,470 | $93,280 |
| 2013 | $3,683 | $118,790 | $29,960 | $88,830 |
Source: Public Records
Map
Nearby Homes
- 320 E Columbus St
- 781 Bruck St
- 707 Sycamore Place Unit 707
- 307 E Sycamore St
- 418 Forest St
- 432 E Kossuth St
- 278 E Sycamore St
- 420 Stanley Ave
- 243 E Whittier St Unit 245
- 688 S 5th St
- 639 S Grant Ave
- 628 S Grant Ave
- 783 Mohawk St
- 616 S Grant Ave Unit 3B
- 745 Mohawk St
- 279-281 E Beck St
- 273 Reinhard Ave
- 649 S 5th St
- 517 Forest St
- 497 E Kossuth St
- 308 E Columbus St
- 319 E Frankfort St
- 313 E Frankfort St
- 785 Ebner St
- 779 Ebner St
- 780 Jaeger St
- 776 Jaeger St
- 786 Jaeger St
- 789-791 Ebner St
- 789 Ebner St Unit 791
- 775 Ebner St
- 807 Ebner St
- 772 Jaeger St
- 768 Jaeger St
- 309 E Columbus St
- 311 E Columbus St
- 809 Ebner St
- 773 Ebner St
- 307 E Columbus St
- 764 Jaeger St