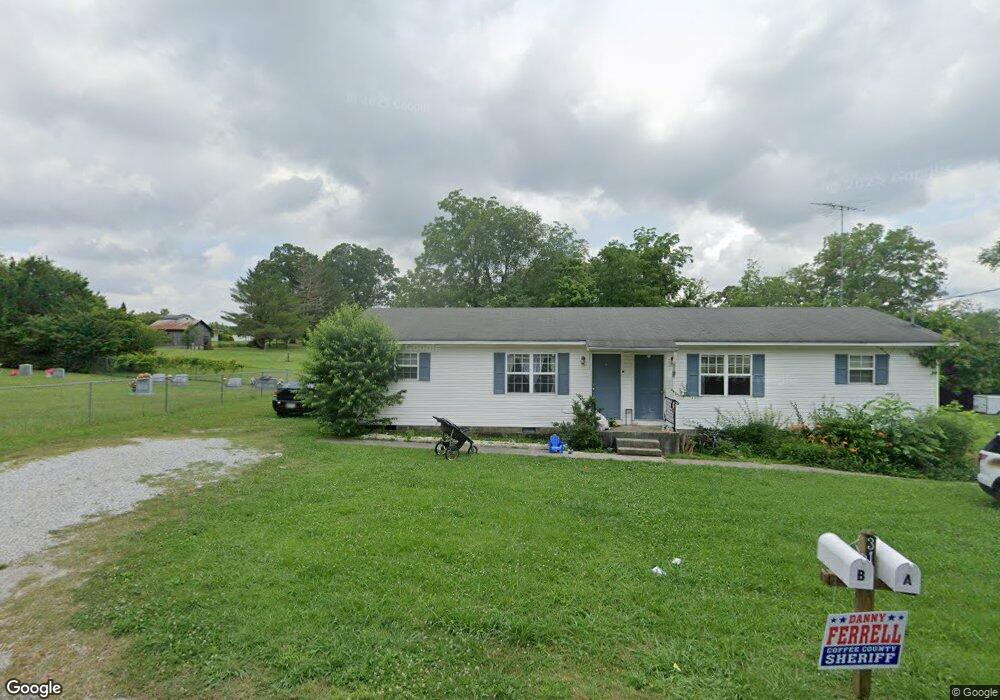
310 Indian Mound Rd Manchester, TN 37355
Estimated Value: $219,434 - $383,000
6
Beds
3
Baths
2,880
Sq Ft
$112/Sq Ft
Est. Value
About This Home
This home is located at 310 Indian Mound Rd, Manchester, TN 37355 and is currently estimated at $323,145, approximately $112 per square foot. 310 Indian Mound Rd is a home located in Coffee County with nearby schools including Westwood Middle School and Temple Baptist Christian School.
Ownership History
Date
Name
Owned For
Owner Type
Purchase Details
Closed on
Jul 23, 2024
Sold by
Clark James E
Bought by
Morales Velazquez Josue and Juarez Lopez Fabian
Current Estimated Value
Home Financials for this Owner
Home Financials are based on the most recent Mortgage that was taken out on this home.
Original Mortgage
$321,600
Outstanding Balance
$317,729
Interest Rate
6.95%
Mortgage Type
New Conventional
Estimated Equity
$5,416
Purchase Details
Closed on
Dec 8, 2006
Bought by
Clark James E
Purchase Details
Closed on
Jul 19, 2000
Sold by
Baker Meredith
Bought by
Casey Emma
Purchase Details
Closed on
Jul 18, 2000
Sold by
Baker Baker Meredith Meredith and Baker Casey J B Meredith
Bought by
Baker Meredith
Purchase Details
Closed on
Aug 21, 1986
Bought by
Baker Casey J and Baker Meredith
Create a Home Valuation Report for This Property
The Home Valuation Report is an in-depth analysis detailing your home's value as well as a comparison with similar homes in the area
Home Values in the Area
Average Home Value in this Area
Purchase History
| Date | Buyer | Sale Price | Title Company |
|---|---|---|---|
| Morales Velazquez Josue | $402,000 | Absolute Title & Escrow | |
| Clark James E | $79,500 | -- | |
| Casey Emma | -- | -- | |
| Baker Meredith | -- | -- | |
| Baker Casey J | $5,000 | -- |
Source: Public Records
Mortgage History
| Date | Status | Borrower | Loan Amount |
|---|---|---|---|
| Open | Morales Velazquez Josue | $321,600 |
Source: Public Records
Tax History Compared to Growth
Tax History
| Year | Tax Paid | Tax Assessment Tax Assessment Total Assessment is a certain percentage of the fair market value that is determined by local assessors to be the total taxable value of land and additions on the property. | Land | Improvement |
|---|---|---|---|---|
| 2024 | $1,290 | $30,600 | $4,160 | $26,440 |
| 2023 | $1,290 | $30,600 | $0 | $0 |
| 2022 | $1,111 | $30,600 | $4,160 | $26,440 |
| 2021 | $1,174 | $25,640 | $3,200 | $22,440 |
| 2020 | $1,174 | $25,640 | $3,200 | $22,440 |
| 2019 | $1,174 | $25,640 | $3,200 | $22,440 |
| 2018 | $1,174 | $25,640 | $3,200 | $22,440 |
| 2017 | $1,291 | $24,600 | $3,200 | $21,400 |
| 2016 | $1,291 | $24,600 | $3,200 | $21,400 |
| 2015 | $1,290 | $24,600 | $3,200 | $21,400 |
| 2014 | $1,291 | $24,609 | $0 | $0 |
Source: Public Records
Map
Nearby Homes
- 207 Glenburg Dr
- 69 Laurel View St
- 37 Laurel View St
- 57 Laurel View St
- 47 Laurel View St
- 27 Laurel View St
- 23 Country Cir
- 210 Rigney Dr
- 54 Country Cir
- 461 Hendrixson Dr
- 163 Stonehenge Ln
- 1989 Elevation JKL Plan at Stonehenge
- 1726 Elevation JKL Plan at Stonehenge
- 1824 Elevation JKL Plan at Stonehenge
- 1258 Stonehenge Plan at Stonehenge
- 2073 Elevation JKL Plan at Stonehenge
- 1624 Elevation JKL Plan at Stonehenge
- Henry Plan at Stonehenge
- 1315 Elevation JKL Plan at Stonehenge
- 1489 Elevation JKL Plan at Stonehenge
- 310 Indian Mound Rd Unit A
- 310 Indian Mound Rd Unit A&B
- 309 Indian Mound Rd Unit A or B
- 309 Indian Mound Rd
- 309 Indian Mound Rd Unit A&B
- 302 Indian Mound Rd Unit A
- 301 Indian Mound Rd
- 112 Ewell St
- 114 Ewell St
- 116 Ewell St
- 111 Hendrixson Dr
- 364 Walker St
- 91 Hendrixson Dr
- 342 Walker St
- 386 Walker St
- 125 Hendrixson Dr
- 324 Walker St
- 151 Hendrixson Dr
- 108 Ewell St
- 402 Walker St