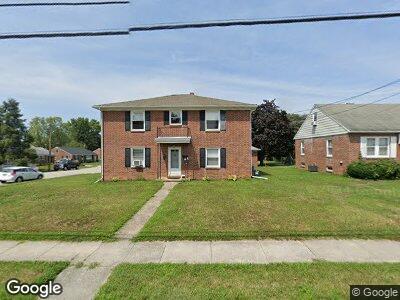
310 Mckinley Ave Hanover, PA 17331
Hanover Historic District NeighborhoodEstimated Value: $292,000 - $414,000
4
Beds
2
Baths
3,040
Sq Ft
$109/Sq Ft
Est. Value
About This Home
This home is located at 310 Mckinley Ave, Hanover, PA 17331 and is currently estimated at $330,156, approximately $108 per square foot. 310 Mckinley Ave is a home located in York County with nearby schools including Clearview Elementary School, Washington Elementary School, and Hanover Middle School.
Ownership History
Date
Name
Owned For
Owner Type
Purchase Details
Closed on
Jul 6, 2001
Sold by
Baxter Investment Group Inc
Bought by
Lowman Laura
Current Estimated Value
Home Financials for this Owner
Home Financials are based on the most recent Mortgage that was taken out on this home.
Original Mortgage
$101,776
Outstanding Balance
$41,067
Interest Rate
7.16%
Estimated Equity
$289,089
Purchase Details
Closed on
May 9, 1996
Sold by
Leese Laverne L and Leese Brenda A
Bought by
Kale Ii John P
Create a Home Valuation Report for This Property
The Home Valuation Report is an in-depth analysis detailing your home's value as well as a comparison with similar homes in the area
Home Values in the Area
Average Home Value in this Area
Purchase History
| Date | Buyer | Sale Price | Title Company |
|---|---|---|---|
| Lowman Laura | $99,900 | -- | |
| Kale Ii John P | $125,000 | -- |
Source: Public Records
Mortgage History
| Date | Status | Borrower | Loan Amount |
|---|---|---|---|
| Open | Lowman Laura | $101,776 |
Source: Public Records
Tax History Compared to Growth
Tax History
| Year | Tax Paid | Tax Assessment Tax Assessment Total Assessment is a certain percentage of the fair market value that is determined by local assessors to be the total taxable value of land and additions on the property. | Land | Improvement |
|---|---|---|---|---|
| 2025 | $6,201 | $169,380 | $27,180 | $142,200 |
| 2024 | $6,154 | $169,380 | $27,180 | $142,200 |
| 2023 | $6,106 | $169,380 | $27,180 | $142,200 |
| 2022 | $6,032 | $169,380 | $27,180 | $142,200 |
| 2021 | $5,862 | $169,380 | $27,180 | $142,200 |
| 2020 | $5,862 | $169,380 | $27,180 | $142,200 |
| 2019 | $5,771 | $169,380 | $27,180 | $142,200 |
| 2018 | $5,664 | $169,380 | $27,180 | $142,200 |
| 2017 | $5,557 | $169,380 | $27,180 | $142,200 |
| 2016 | $0 | $169,380 | $27,180 | $142,200 |
| 2015 | -- | $169,380 | $27,180 | $142,200 |
| 2014 | -- | $169,380 | $27,180 | $142,200 |
Source: Public Records
Map
Nearby Homes