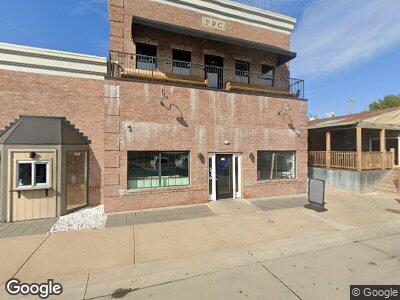
310 SW Main St Lees Summit, MO 64063
Lee's Summit NeighborhoodEstimated Value: $194,500
--
Bed
--
Bath
1,677
Sq Ft
$116/Sq Ft
Est. Value
About This Home
This home is located at 310 SW Main St, Lees Summit, MO 64063 and is currently priced at $194,500, approximately $115 per square foot. 310 SW Main St is a home located in Jackson County with nearby schools including Bernard C. Campbell Middle School, Westview Elementary School, and Lee's Summit North High School.
Ownership History
Date
Name
Owned For
Owner Type
Purchase Details
Closed on
Sep 23, 2013
Sold by
Spe Wolf Main Missouri Llc
Bought by
Woodle Properties Llc
Current Estimated Value
Home Financials for this Owner
Home Financials are based on the most recent Mortgage that was taken out on this home.
Original Mortgage
$944,000
Outstanding Balance
$724,987
Interest Rate
4.46%
Mortgage Type
Commercial
Purchase Details
Closed on
May 8, 2013
Sold by
Bank Midwest
Bought by
Spe Wolf Main Missouri Llc
Purchase Details
Closed on
Jun 19, 2002
Sold by
Fp Llc
Bought by
Main Street Centre Llc
Home Financials for this Owner
Home Financials are based on the most recent Mortgage that was taken out on this home.
Original Mortgage
$1,181,200
Interest Rate
6.82%
Mortgage Type
Commercial
Create a Home Valuation Report for This Property
The Home Valuation Report is an in-depth analysis detailing your home's value as well as a comparison with similar homes in the area
Home Values in the Area
Average Home Value in this Area
Purchase History
| Date | Buyer | Sale Price | Title Company |
|---|---|---|---|
| Woodle Properties Llc | -- | Thomson Affinity Title Llc | |
| Spe Wolf Main Missouri Llc | $1,010,500 | None Available | |
| Main Street Centre Llc | -- | Coffelt Land Title Inc |
Source: Public Records
Mortgage History
| Date | Status | Borrower | Loan Amount |
|---|---|---|---|
| Open | Woodle Properties Llc | $944,000 | |
| Previous Owner | Main Street Centre Llc | $1,360,000 | |
| Previous Owner | Main Street Centre Llc | $310,000 | |
| Previous Owner | Main Street Centre Llc | $76,828 | |
| Previous Owner | Main Street Centre Llc | $1,181,200 |
Source: Public Records
Tax History Compared to Growth
Tax History
| Year | Tax Paid | Tax Assessment Tax Assessment Total Assessment is a certain percentage of the fair market value that is determined by local assessors to be the total taxable value of land and additions on the property. | Land | Improvement |
|---|---|---|---|---|
| 2024 | $39,928 | $464,000 | $288,000 | $176,000 |
| 2023 | $39,928 | $512,000 | $300,000 | $212,000 |
| 2022 | $38,951 | $409,600 | $240,000 | $169,600 |
| 2021 | $39,635 | $430,080 | $240,000 | $190,080 |
| 2020 | $39,968 | $471,264 | $276,224 | $195,040 |
| 2019 | $44,913 | $471,264 | $276,224 | $195,040 |
| 2018 | $33,290 | $327,712 | $138,112 | $189,600 |
| 2017 | $33,290 | $327,712 | $138,112 | $189,600 |
| 2016 | $29,393 | $286,818 | $106,240 | $180,578 |
| 2014 | $29,309 | $281,136 | $106,240 | $174,896 |
Source: Public Records
Map
Nearby Homes
- 7 NE Forest Ave
- 205 NE Orchard St
- 27004 NW Olive St
- 1 NW Noel St
- 105 SW Donovan Rd
- 308 SW Highland St
- 515 NE Florence Ave
- 203 NW Ward Rd
- 313 NE Corder St
- 607 NE Chipman Rd
- 114 SE Summit Ave
- 503 SE 3rd St
- 508 NW Village Dr
- 626 NW Village Dr
- 228 NE Dreamweaver Ave
- 606 SE 3rd Terrace
- 602 SW Lea Dr
- 220 NE Fiddlewood Ave
- 248 NE Dreamweaver Ave
- 629 NE Swann Cir
- 310 SW Main St
- 308 NE Main St
- 306 NE Main St
- 1 NE Forest Ave
- 304 NE Main St
- 4 NW Forest Ave
- 307 NE Main St
- 9 NW Forest Ave
- 401 NE Main St
- 401 NE Main St
- 3 NE Forest Ave
- 307 NW Central St
- 8 NW Forest Ave
- 11 NW Forest Ave
- 405 NE Main St
- 305 NE Main St Unit A
- 4 NE Forest Ave
- 315 NW Central St
- 416 NE Main St
- 311 NW Central St