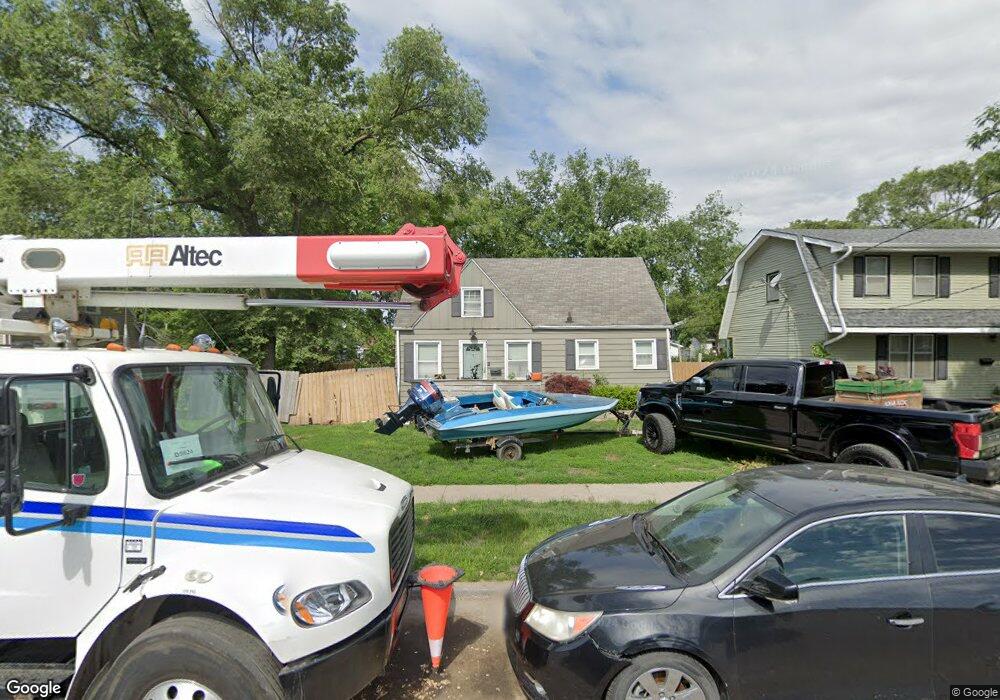
3100 Oxford St Des Moines, IA 50313
Highland Park NeighborhoodEstimated Value: $144,000 - $191,000
3
Beds
1
Bath
1,037
Sq Ft
$162/Sq Ft
Est. Value
About This Home
This home is located at 3100 Oxford St, Des Moines, IA 50313 and is currently estimated at $167,530, approximately $161 per square foot. 3100 Oxford St is a home located in Polk County with nearby schools including Findley Elementary School, Harding Middle School, and North High School.
Ownership History
Date
Name
Owned For
Owner Type
Purchase Details
Closed on
Oct 29, 2021
Sold by
Jorgensen John and Jorgensen Angela
Bought by
Decarlo Mitchell James
Current Estimated Value
Purchase Details
Closed on
Sep 23, 2016
Sold by
Maclin Michelle R
Bought by
Maclin Whitney M
Purchase Details
Closed on
Oct 23, 1999
Sold by
Davis David L and Davis David Lester
Bought by
Maclin Michelle R
Home Financials for this Owner
Home Financials are based on the most recent Mortgage that was taken out on this home.
Original Mortgage
$55,955
Interest Rate
7.87%
Create a Home Valuation Report for This Property
The Home Valuation Report is an in-depth analysis detailing your home's value as well as a comparison with similar homes in the area
Home Values in the Area
Average Home Value in this Area
Purchase History
| Date | Buyer | Sale Price | Title Company |
|---|---|---|---|
| Decarlo Mitchell James | $14,000 | None Available | |
| Maclin Whitney M | $90,000 | None Available | |
| Maclin Michelle R | $58,500 | -- |
Source: Public Records
Mortgage History
| Date | Status | Borrower | Loan Amount |
|---|---|---|---|
| Previous Owner | Maclin Michelle R | $55,955 | |
| Closed | Maclin Michelle R | $5,000 |
Source: Public Records
Tax History Compared to Growth
Tax History
| Year | Tax Paid | Tax Assessment Tax Assessment Total Assessment is a certain percentage of the fair market value that is determined by local assessors to be the total taxable value of land and additions on the property. | Land | Improvement |
|---|---|---|---|---|
| 2025 | $2,680 | $155,000 | $32,000 | $123,000 |
| 2024 | $2,680 | $136,200 | $27,700 | $108,500 |
| 2023 | $2,514 | $136,200 | $27,700 | $108,500 |
| 2022 | $2,496 | $106,700 | $22,200 | $84,500 |
| 2021 | $2,360 | $106,700 | $22,200 | $84,500 |
| 2020 | $2,452 | $94,600 | $19,600 | $75,000 |
| 2019 | $2,274 | $94,600 | $19,600 | $75,000 |
| 2018 | $2,250 | $84,600 | $17,300 | $67,300 |
| 2017 | $1,908 | $84,600 | $17,300 | $67,300 |
| 2016 | $1,854 | $79,100 | $15,800 | $63,300 |
| 2015 | $1,854 | $79,100 | $15,800 | $63,300 |
| 2014 | $1,818 | $79,900 | $15,700 | $64,200 |
Source: Public Records
Map
Nearby Homes
- 3200 Oxford St
- 3118 1st St
- 2925 2nd Ave
- 3012 Cornell St
- 3308 Cambridge St
- 2826 Oxford St
- 3007 Cornell St
- 3220 Cornell St
- 2807 1st St
- 3019 Columbia St
- 3413 2nd Ave
- 3208 Bowdoin St
- 3107 5th Ave
- 2818 Bowdoin St
- 2701 Cornell St
- 3131 6th Ave
- 3314 5th Ave
- 3409 Bowdoin St
- 3615 Cambridge St
- 3623 Cambridge St