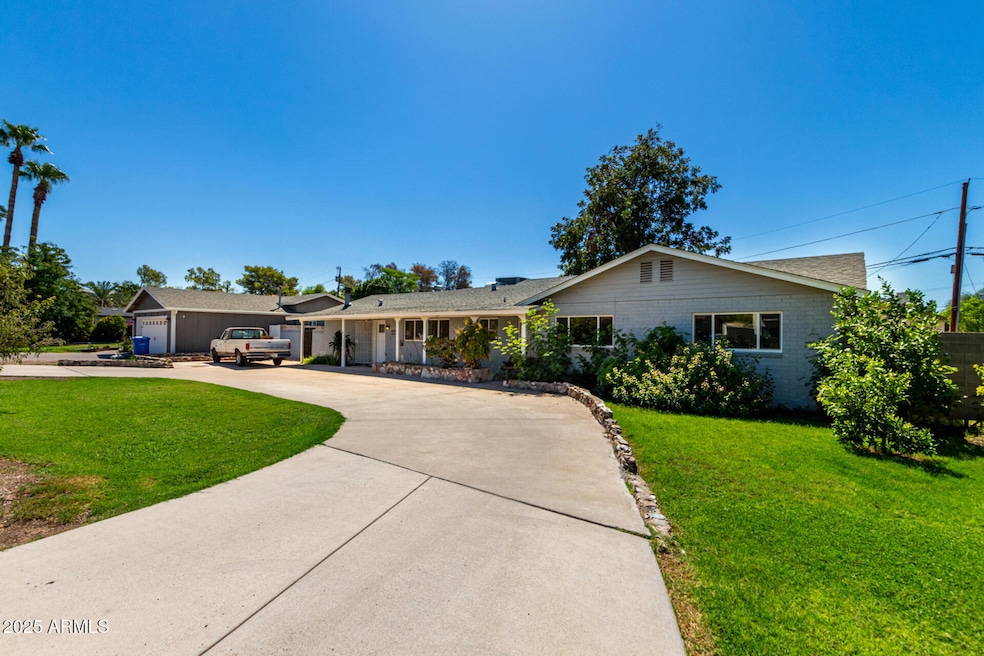
3101 E Campbell Ave Phoenix, AZ 85016
Camelback East Village NeighborhoodEstimated payment $3,972/month
Highlights
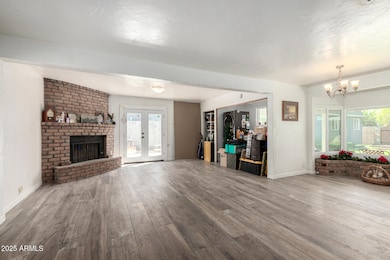
- 1 Fireplace
- No HOA
- Tile Flooring
- Phoenix Coding Academy Rated A
- Double Pane Windows
- Central Air
About This Home
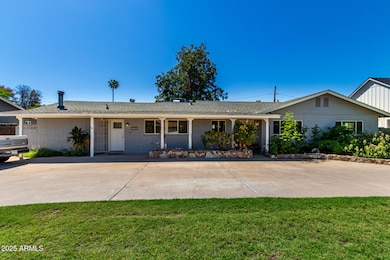
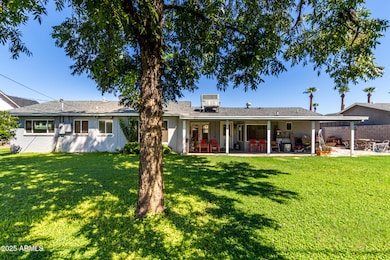
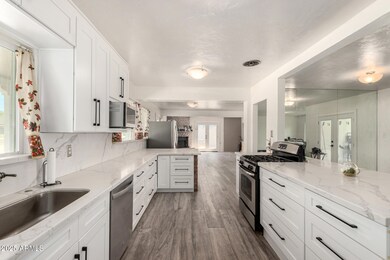
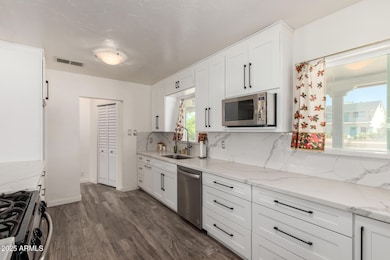
Listed below appraised value! Modern Comfort Meets Classic 85016 Charm. Tucked away on an oversized lush irrigated lot, this home offers the perfect blend of character and opportunity to make it your own. Bright, open living spaces flow into a chef's kitchen and generous bedrooms for ultimate comfort. The backyard is a rare find sprawling green space, mature trees, and endless possibilities for entertaining or expansion. All just minutes from the Biltmore, Camelback Corridor, and top dining spots.
Home Details
Home Type
- Single Family
Est. Annual Taxes
- $3,456
Year Built
- Built in 1951
Lot Details
- 10,363 Sq Ft Lot
- Block Wall Fence
- Grass Covered Lot
Parking
- 5 Open Parking Spaces
Home Design
- Composition Roof
- Block Exterior
Interior Spaces
- 1,962 Sq Ft Home
- 1-Story Property
- 1 Fireplace
- Double Pane Windows
- Family or Dining Combination
- Tile Flooring
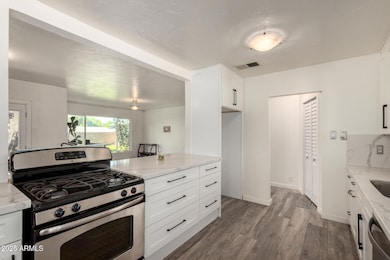
Kitchen
- Gas Oven
- Gas Range
- Dishwasher
Bedrooms and Bathrooms
- 3 Bedrooms
- 2 Full Bathrooms
Laundry
- Laundry in unit
- Washer Hookup
Schools
- Madison Camelview Elementary School
- Madison Park Middle School
- Camelback High School
Utilities
- Central Air
- Heating Available
Community Details
- No Home Owners Association
- Association fees include no fees
- Valencia Gardens Subdivision
Listing and Financial Details
- Tax Lot 8
- Assessor Parcel Number 163-03-073
Map
Home Values in the Area
Average Home Value in this Area
Tax History
| Year | Tax Paid | Tax Assessment Tax Assessment Total Assessment is a certain percentage of the fair market value that is determined by local assessors to be the total taxable value of land and additions on the property. | Land | Improvement |
|---|---|---|---|---|
| 2025 | $3,635 | $31,701 | -- | -- |
| 2024 | $3,356 | $30,191 | -- | -- |
| 2023 | $3,356 | $51,660 | $10,330 | $41,330 |
| 2022 | $3,249 | $40,750 | $8,150 | $32,600 |
| 2021 | $3,314 | $36,180 | $7,230 | $28,950 |
| 2020 | $3,261 | $33,210 | $6,640 | $26,570 |
| 2019 | $3,187 | $33,030 | $6,600 | $26,430 |
| 2018 | $3,103 | $28,570 | $5,710 | $22,860 |
| 2017 | $2,946 | $28,510 | $5,700 | $22,810 |
| 2016 | $2,839 | $25,780 | $5,150 | $20,630 |
| 2015 | $2,642 | $25,480 | $5,090 | $20,390 |
Property History
| Date | Event | Price | List to Sale | Price per Sq Ft |
|---|---|---|---|---|
| 01/14/2026 01/14/26 | Sold | $680,000 | -1.4% | $347 / Sq Ft |
| 01/14/2026 01/14/26 | Price Changed | $690,000 | 0.0% | $352 / Sq Ft |
| 01/14/2026 01/14/26 | For Sale | $690,000 | 0.0% | $352 / Sq Ft |
| 12/04/2025 12/04/25 | Price Changed | $690,000 | -12.5% | $352 / Sq Ft |
| 10/30/2025 10/30/25 | Price Changed | $789,000 | -6.1% | $402 / Sq Ft |
| 09/07/2025 09/07/25 | For Sale | $839,900 | -- | $428 / Sq Ft |
Purchase History
| Date | Type | Sale Price | Title Company |
|---|---|---|---|
| Warranty Deed | $219,900 | American Title Insurance | |
| Interfamily Deed Transfer | -- | American Title Insurance |
Mortgage History
| Date | Status | Loan Amount | Loan Type |
|---|---|---|---|
| Open | $197,910 | No Value Available | |
| Previous Owner | $175,000 | No Value Available |
Source: Arizona Regional Multiple Listing Service (ARMLS)
MLS Number: 6903292
APN: 163-03-073
Disclaimer: Certain information contained herein is derived from information provided by parties other than Homes.com. All information provided is deemed reliable, but is not guaranteed to be accurate and should be independently verified.
![]() All information should be verified by the recipient and none is guaranteed as accurate by ARMLS
All information should be verified by the recipient and none is guaranteed as accurate by ARMLS
Listing Information presented by local MLS brokerage: Ten-X, local REALTOR®- Arlene Richardson - (888)-952-6393
- 3023 E Sells Dr
- 4501 N 30th Place
- 3001 E Campbell Ave
- 3034 E Turney Ave
- 4409 N 32nd St
- 3015 E Coolidge St Unit 2
- 3035 E Coolidge St
- 4445 N 29th Place
- 3225 E Sells Dr
- 3046 E Glenrosa Ave
- 3010 E Glenrosa Ave
- 3002 E Glenrosa Ave
- 2846 E Campbell Ave
- 3247 E Sells Dr
- 3150 E Glenrosa Ave Unit 1
- 4341 N 32nd Way
- 4652 N 29th St
- 2825 E Campbell Ave
- 3226 E Glenrosa Ave
- 4323 N 28th Way
- 3229 E Campbell Ave
- 2931 E Madison Vistas Dr
- 3035 E Coolidge St
- 3247 E Sells Dr
- 3140 E Glenrosa Ave Unit 3
- 4242 N 31st Place
- 4220 N 32nd St Unit 37
- 4225 N 32nd Place Unit SI ID1468028P
- 4225 N 32nd Place Unit SI ID1492095P
- 3035 E Heatherbrae Dr
- 2821 E Turney Ave Unit 2
- 4313 N 28th St
- 3033 E Devonshire Ave Unit 1013
- 3033 E Devonshire Ave Unit 3032
- 4416 N 27th Way
- 2912 E Pierson St
- 4229 N 34th St
- 2737 E Glenrosa Ave Unit 7
- 2912 E Indian School Rd
- 4402 N 36th St

Ask me questions while you tour the home.