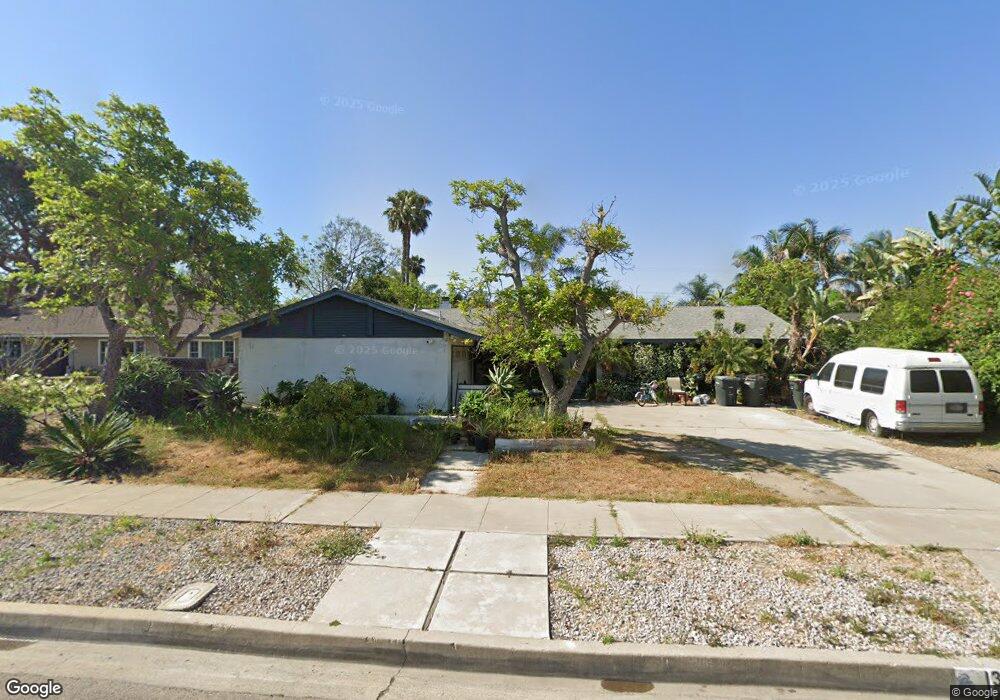
3102 E Garnet Ln Orange, CA 92869
Estimated Value: $1,238,000 - $1,384,000
4
Beds
2
Baths
2,328
Sq Ft
$566/Sq Ft
Est. Value
About This Home
This home is located at 3102 E Garnet Ln, Orange, CA 92869 and is currently estimated at $1,318,272, approximately $566 per square foot. 3102 E Garnet Ln is a home located in Orange County with nearby schools including La Veta Elementary School, El Modena High School, and Spirit Christian Academy.
Ownership History
Date
Name
Owned For
Owner Type
Purchase Details
Closed on
Jan 14, 2021
Sold by
Feist Linda L
Bought by
Feist Linda L and Feist Kirk T
Current Estimated Value
Purchase Details
Closed on
Nov 2, 2016
Sold by
Feist Linda L
Bought by
Feist Linda L and Linda L Feist Trust
Purchase Details
Closed on
Sep 18, 2007
Sold by
Feist Linda L
Bought by
Feist Linda L and Feist Kirk K
Home Financials for this Owner
Home Financials are based on the most recent Mortgage that was taken out on this home.
Original Mortgage
$105,000
Interest Rate
6.4%
Mortgage Type
New Conventional
Purchase Details
Closed on
Oct 27, 2004
Sold by
Warner Feist Linda Louise
Bought by
Feist Linda L and Linda L Feist Revocable Living Trust
Purchase Details
Closed on
Sep 18, 2003
Sold by
Warner Kent
Bought by
Warner Feist Linda Louise
Create a Home Valuation Report for This Property
The Home Valuation Report is an in-depth analysis detailing your home's value as well as a comparison with similar homes in the area
Home Values in the Area
Average Home Value in this Area
Purchase History
| Date | Buyer | Sale Price | Title Company |
|---|---|---|---|
| Feist Linda L | -- | None Available | |
| Feist Linda L | -- | None Available | |
| Feist Linda L | -- | None Available | |
| Feist Linda L | -- | Homeconnects Title | |
| Feist Linda L | -- | -- | |
| Warner Feist Linda Louise | -- | -- |
Source: Public Records
Mortgage History
| Date | Status | Borrower | Loan Amount |
|---|---|---|---|
| Closed | Feist Linda L | $105,000 |
Source: Public Records
Tax History
| Year | Tax Paid | Tax Assessment Tax Assessment Total Assessment is a certain percentage of the fair market value that is determined by local assessors to be the total taxable value of land and additions on the property. | Land | Improvement |
|---|---|---|---|---|
| 2025 | $1,841 | $146,926 | $53,635 | $93,291 |
| 2024 | $1,841 | $144,046 | $52,584 | $91,462 |
| 2023 | $1,795 | $141,222 | $51,553 | $89,669 |
| 2022 | $1,756 | $138,453 | $50,542 | $87,911 |
| 2021 | $1,710 | $135,739 | $49,551 | $86,188 |
| 2020 | $1,693 | $134,348 | $49,043 | $85,305 |
| 2019 | $1,674 | $131,714 | $48,081 | $83,633 |
| 2018 | $1,648 | $129,132 | $47,138 | $81,994 |
| 2017 | $1,586 | $126,600 | $46,213 | $80,387 |
| 2016 | $1,556 | $124,118 | $45,307 | $78,811 |
| 2015 | $1,532 | $122,254 | $44,626 | $77,628 |
| 2014 | $1,498 | $119,860 | $43,752 | $76,108 |
Source: Public Records
Map
Nearby Homes
- 17922 Romelle Ave
- 3030 E Elgin Place
- 18161 Larkstone Dr
- 732 S Woodland St
- 449 S Wellington Rd
- 821 S Fairmont Way
- 547 S Yorba St
- 244 S Violet Ln
- 338 S James St
- 3836 E Ruth Place
- 235 S Dunas St
- 369 S Jennifer Ln
- 2610 Deodar St
- 2443 Deodar St Unit 2
- 17572 Leafwood Ln
- 4346 E Casselle Ave
- 2318 Franzen Ave
- 13662 Loretta Dr
- 2232 Joana Dr
- 3139 E Chapman Ave Unit 3B
- 3114 E Garnet Ln
- 3040 E Garnet Ln
- 17861 Romelle Ave
- 17851 Romelle Ave
- 3028 E Garnet Ln
- 3126 E Garnet Ln
- 17881 Romelle Ave
- 3101 E Garnet Ln
- 17831 Romelle Ave
- 3041 E Garnet Ln
- 3115 E Garnet Ln
- 3016 E Garnet Ln
- 3138 E Garnet Ln
- 3029 E Garnet Ln
- 17901 Romelle Ave
- 3127 E Garnet Ln
- 17811 Romelle Ave
- 3015 E Garnet Ln
- 3200 E Garnet Ln
- 3002 E Garnet Ln
Your Personal Tour Guide
Ask me questions while you tour the home.