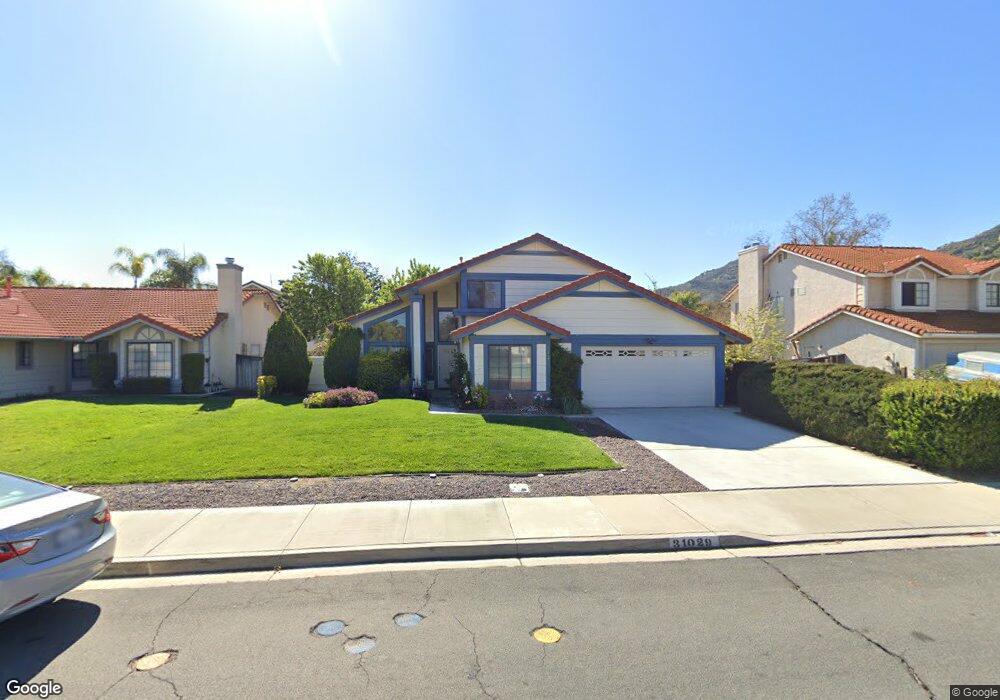
31029 Via Gilberto Temecula, CA 92592
Estimated Value: $718,346 - $765,000
4
Beds
3
Baths
2,113
Sq Ft
$352/Sq Ft
Est. Value
About This Home
This home is located at 31029 Via Gilberto, Temecula, CA 92592 and is currently estimated at $744,337, approximately $352 per square foot. 31029 Via Gilberto is a home located in Riverside County with nearby schools including Temecula Luiseno Elementary, Erle Stanley Gardner Middle School, and Great Oak High School.
Ownership History
Date
Name
Owned For
Owner Type
Purchase Details
Closed on
Jul 25, 2012
Sold by
Lucas Robert
Bought by
Lucas Mary Elizabeth
Current Estimated Value
Purchase Details
Closed on
Sep 2, 2004
Sold by
Lucas Robert and Lucas Mary Elizabeth
Bought by
Lucas Robert and Lucas Mary Elizabeth
Home Financials for this Owner
Home Financials are based on the most recent Mortgage that was taken out on this home.
Original Mortgage
$250,000
Outstanding Balance
$124,764
Interest Rate
5.99%
Mortgage Type
Purchase Money Mortgage
Estimated Equity
$619,573
Purchase Details
Closed on
Aug 7, 1998
Sold by
Pedraza Baldomero D and Pedraza Elisa M
Bought by
Lucas Robert and Lucas Elizabeth Lucas
Home Financials for this Owner
Home Financials are based on the most recent Mortgage that was taken out on this home.
Original Mortgage
$173,298
Interest Rate
6.91%
Mortgage Type
VA
Create a Home Valuation Report for This Property
The Home Valuation Report is an in-depth analysis detailing your home's value as well as a comparison with similar homes in the area
Home Values in the Area
Average Home Value in this Area
Purchase History
| Date | Buyer | Sale Price | Title Company |
|---|---|---|---|
| Lucas Mary Elizabeth | -- | None Available | |
| Lucas Robert | -- | Itc Sb | |
| Lucas Robert | $169,909 | Stewart Title |
Source: Public Records
Mortgage History
| Date | Status | Borrower | Loan Amount |
|---|---|---|---|
| Open | Lucas Robert | $250,000 | |
| Closed | Lucas Robert | $173,298 |
Source: Public Records
Tax History Compared to Growth
Tax History
| Year | Tax Paid | Tax Assessment Tax Assessment Total Assessment is a certain percentage of the fair market value that is determined by local assessors to be the total taxable value of land and additions on the property. | Land | Improvement |
|---|---|---|---|---|
| 2025 | $5,576 | $282,782 | $54,854 | $227,928 |
| 2023 | $5,576 | $271,803 | $52,725 | $219,078 |
| 2022 | $5,462 | $266,475 | $51,692 | $214,783 |
| 2021 | $5,387 | $261,251 | $50,679 | $210,572 |
| 2020 | $5,329 | $258,573 | $50,160 | $208,413 |
| 2019 | $5,280 | $253,504 | $49,177 | $204,327 |
| 2018 | $3,083 | $248,534 | $48,213 | $200,321 |
| 2017 | $3,025 | $243,662 | $47,268 | $196,394 |
| 2016 | $2,967 | $238,886 | $46,342 | $192,544 |
| 2015 | $2,912 | $235,299 | $45,647 | $189,652 |
| 2014 | $2,820 | $230,691 | $44,753 | $185,938 |
Source: Public Records
Map
Nearby Homes
- 31250 Comotilo Ct
- 45320 Esmerado Ct
- 45342 Maguey Ct
- 45282 Esplendor Ct
- 31244 Locust Ct
- 45590 Alpine Place
- 31340 Locust Ct
- 45579 Basswood Ct
- 31379 Corte Lindo
- 45471 Olive Ct
- 45594 Calle Luna
- 45763 Via Nubes
- 31808 Green Oak Way
- 31257 Via Nubes
- 45723 Pheasant Place
- 31312 Calle Cirros
- 31268 Via Nubes
- 45495 Peacock Place
- 46223 Timbermine Ln Unit 55
- 45575 Hawk Ct
- 31037 Via Gilberto
- 31021 Via Gilberto
- 30954 Shaba Cir
- 30962 Shaba Cir
- 31045 Via Gilberto
- 30970 Shaba Cir
- 30946 Shaba Cir
- 31126 Ruidosa St
- 31053 Via Gilberto
- 31121 Ruidosa St
- 31122 Ruidosa St
- 30951 Shaba Cir
- 31118 Ruidosa St
- 31125 Tecumseh Ct
- 31121 Tecumseh Ct
- 30959 Shaba Cir
- 30967 Shaba Cir
- 31113 Ruidosa St
- 31114 Ruidosa St
- 31002 Shaba Cir