Estimated Value: $304,000 - $403,000
3
Beds
2
Baths
1,183
Sq Ft
$311/Sq Ft
Est. Value
About This Home
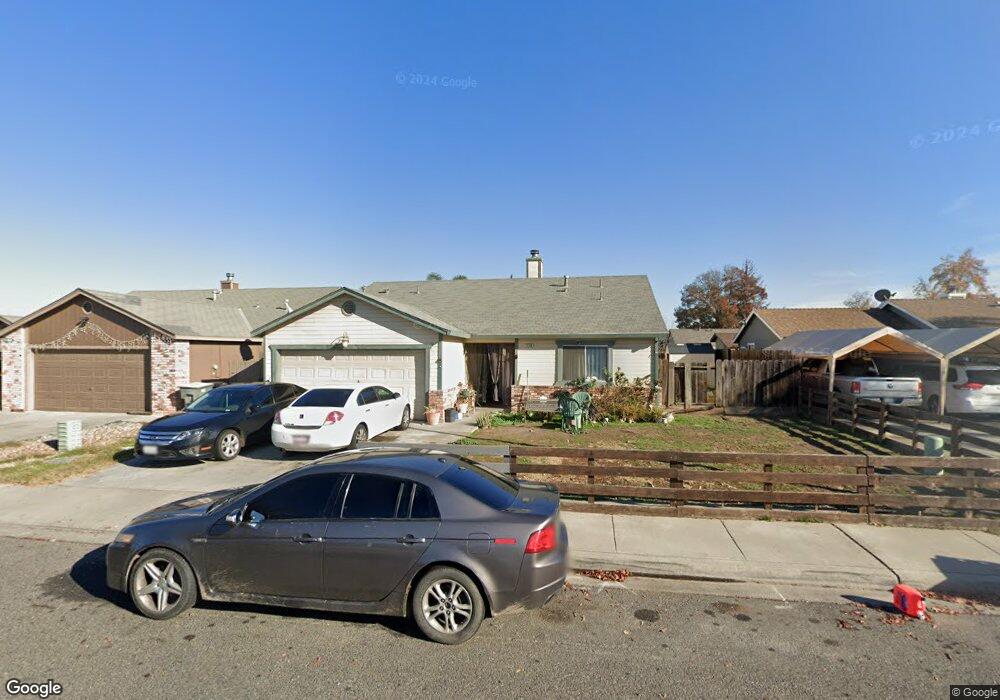
This home is located at 3104 Aarvig Ct, Ceres, CA 95307 and is currently estimated at $367,449, approximately $310 per square foot. 3104 Aarvig Ct is a home located in Stanislaus County with nearby schools including Don Pedro Elementary School, Blaker-Kinser Junior High School, and Central Valley High School.
Ownership History
Date
Name
Owned For
Owner Type
Purchase Details
Closed on
Aug 5, 2016
Sold by
Ballam David and Ballam Chandra
Bought by
Ballam Chandra M and Ballam David
Current Estimated Value
Home Financials for this Owner
Home Financials are based on the most recent Mortgage that was taken out on this home.
Original Mortgage
$150,000
Outstanding Balance
$119,358
Interest Rate
3.48%
Mortgage Type
New Conventional
Estimated Equity
$248,091
Purchase Details
Closed on
Mar 5, 2001
Sold by
Avery Greg and Avery Julie
Bought by
Ballam David and Ballam Chandra
Home Financials for this Owner
Home Financials are based on the most recent Mortgage that was taken out on this home.
Original Mortgage
$96,983
Interest Rate
6.97%
Mortgage Type
FHA
Purchase Details
Closed on
Aug 11, 1998
Sold by
Avery & Hayes Inc
Bought by
Avery Greg and Avery Julie
Create a Home Valuation Report for This Property
The Home Valuation Report is an in-depth analysis detailing your home's value as well as a comparison with similar homes in the area
Purchase History
| Date | Buyer | Sale Price | Title Company |
|---|---|---|---|
| Ballam Chandra M | -- | Chicago Title Company | |
| Ballam David | $112,500 | First American Title Ins Co | |
| Avery Greg | -- | First American Title Co |
Source: Public Records
Mortgage History
| Date | Status | Borrower | Loan Amount |
|---|---|---|---|
| Open | Ballam Chandra M | $150,000 | |
| Closed | Ballam David | $96,983 | |
| Closed | Ballam David | $19,650 |
Source: Public Records
Tax History
| Year | Tax Paid | Tax Assessment Tax Assessment Total Assessment is a certain percentage of the fair market value that is determined by local assessors to be the total taxable value of land and additions on the property. | Land | Improvement |
|---|---|---|---|---|
| 2025 | $2,025 | $169,498 | $67,797 | $101,701 |
| 2024 | $1,900 | $166,175 | $66,468 | $99,707 |
| 2023 | $1,849 | $162,917 | $65,165 | $97,752 |
| 2022 | $1,832 | $159,724 | $63,888 | $95,836 |
| 2021 | $1,813 | $156,593 | $62,636 | $93,957 |
| 2020 | $1,757 | $154,988 | $61,994 | $92,994 |
| 2019 | $1,745 | $151,950 | $60,779 | $91,171 |
| 2018 | $1,710 | $148,972 | $59,588 | $89,384 |
| 2017 | $1,696 | $146,052 | $58,420 | $87,632 |
| 2016 | $1,661 | $143,189 | $57,275 | $85,914 |
| 2015 | $1,639 | $141,039 | $56,415 | $84,624 |
| 2014 | $1,606 | $138,277 | $55,310 | $82,967 |
Source: Public Records
Map
Nearby Homes
- 1931 Hackett Rd
- 2016 Nimrood Dr
- 1717 Don Pedro Rd
- 3600 Spruce Ave
- 3820 Drakewood Ct
- 3816 Dano Ct
- 3501 Soda Canyon Dr
- 3116 Larrynell Dr
- 3939 Central Ave Unit 157
- 3939 Central Ave Unit 35
- 3939 Central Ave Unit 178
- 1429 Don Pedro Rd
- 3816 Teek Ct
- 2590 Magnolia St
- 2313 Thomas St
- 3632 9th St
- 3671 San Juan Rd
- 3449 Guru Dr
- 3651 San Juan Rd
- 2800 Skybrite Dr
- 3100 Aarvig Ct
- 3108 Aarvig Ct
- 3105 Crownview Dr
- 3109 Crownview Dr
- 3101 Crownview Dr
- 1867 Laurelwood Ct
- 1866 Aarvig Ln
- 3201 Crownview Dr
- 3205 Crownview Dr
- 1905 Aarvig Ln
- 1863 Laurelwood Ct
- 1901 Aarvig Ln
- 1862 Aarvig Ln
- 1909 Aarvig Ln
- 1867 Aarvig Ln
- 3209 Crownview Dr
- 1913 Aarvig Ln
- 3104 Crownview Dr
- 3108 Crownview Dr
- 3100 Crownview Dr
Your Personal Tour Guide
Ask me questions while you tour the home.