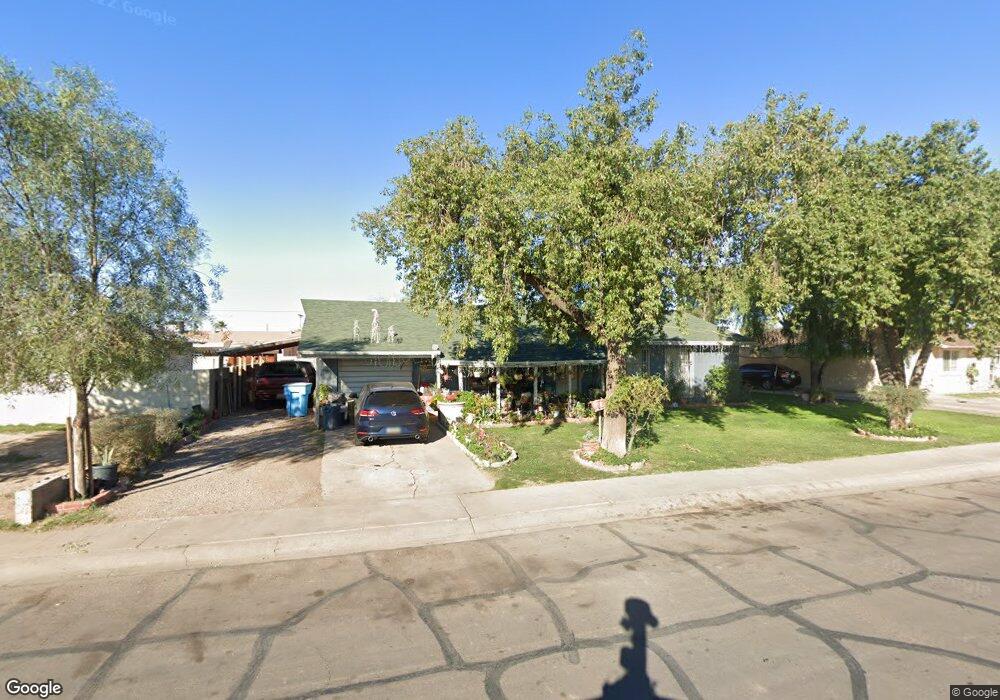
3104 N 39th Dr Phoenix, AZ 85019
Maryvale NeighborhoodEstimated Value: $277,431 - $355,000
3
Beds
2
Baths
1,305
Sq Ft
$249/Sq Ft
Est. Value
About This Home
This home is located at 3104 N 39th Dr, Phoenix, AZ 85019 and is currently estimated at $325,358, approximately $249 per square foot. 3104 N 39th Dr is a home located in Maricopa County with nearby schools including Pueblo Del Sol Middle School, Alhambra High School, and Phoenix Coding Academy.
Ownership History
Date
Name
Owned For
Owner Type
Purchase Details
Closed on
Nov 22, 2005
Sold by
Neri Silvia Sevastian
Bought by
Sandoval Celestino Vidales
Current Estimated Value
Home Financials for this Owner
Home Financials are based on the most recent Mortgage that was taken out on this home.
Original Mortgage
$122,400
Outstanding Balance
$80,434
Interest Rate
9.53%
Mortgage Type
New Conventional
Estimated Equity
$244,924
Purchase Details
Closed on
Jul 11, 2003
Sold by
Beckler Charlene
Bought by
Sandoval Celestino Vidales
Home Financials for this Owner
Home Financials are based on the most recent Mortgage that was taken out on this home.
Original Mortgage
$72,000
Interest Rate
8.5%
Mortgage Type
New Conventional
Purchase Details
Closed on
May 30, 2002
Sold by
Redlin Charles A
Bought by
Redlin Charles A and The Charles A Redlin Revocable Living Tr
Create a Home Valuation Report for This Property
The Home Valuation Report is an in-depth analysis detailing your home's value as well as a comparison with similar homes in the area
Home Values in the Area
Average Home Value in this Area
Purchase History
| Date | Buyer | Sale Price | Title Company |
|---|---|---|---|
| Sandoval Celestino Vidales | -- | Empire Title Agency Of Az Ll | |
| Sandoval Celestino Vidales | $90,000 | Capital Title Agency Inc | |
| Redlin Charles A | -- | -- |
Source: Public Records
Mortgage History
| Date | Status | Borrower | Loan Amount |
|---|---|---|---|
| Open | Sandoval Celestino Vidales | $122,400 | |
| Closed | Sandoval Celestino Vidales | $72,000 |
Source: Public Records
Tax History Compared to Growth
Tax History
| Year | Tax Paid | Tax Assessment Tax Assessment Total Assessment is a certain percentage of the fair market value that is determined by local assessors to be the total taxable value of land and additions on the property. | Land | Improvement |
|---|---|---|---|---|
| 2025 | $698 | $4,755 | -- | -- |
| 2024 | $688 | $4,529 | -- | -- |
| 2023 | $688 | $22,520 | $4,500 | $18,020 |
| 2022 | $653 | $17,050 | $3,410 | $13,640 |
| 2021 | $627 | $14,030 | $2,800 | $11,230 |
| 2020 | $613 | $12,920 | $2,580 | $10,340 |
| 2019 | $599 | $11,130 | $2,220 | $8,910 |
| 2018 | $635 | $10,070 | $2,010 | $8,060 |
| 2017 | $557 | $8,300 | $1,660 | $6,640 |
| 2016 | $541 | $6,760 | $1,350 | $5,410 |
| 2015 | $491 | $6,030 | $1,200 | $4,830 |
Source: Public Records
Map
Nearby Homes
- 3020 N 40th Ave
- 3137 N 37th Dr
- 3136 N 37th Ave
- 3724 W Verde Ln Unit 3
- 3062 N 42nd Ave
- 2720 N 40th Ave
- 4315 W Osborn Rd
- 4338 W Thomas Rd
- 3825 N 39th Ave
- 3856 W Clarendon Ave
- 4420 W Earll Dr
- 4407 W Monterey Way
- 3801 W Wilshire Dr
- 2646 N 43rd Ave Unit B
- 2652 N 43rd Ave Unit C
- 4460 W Avalon Dr
- 3624 W Clarendon Ave
- 2674 N 43rd Ave Unit D
- 3720 W Lewis Ave
- 2690 N 43rd Ave Unit D
- 3108 N 39th Dr
- 3102 N 39th Dr
- 3109 N 40th Ave
- 3105 N 40th Ave
- 3113 N 40th Ave
- 3101 N 39th Dr
- 3116 N 39th Dr
- 3107 N 39th Dr
- 3119 N 40th Ave
- 3101 N 40th Ave
- 3113 N 39th Dr
- 3122 N 39th Dr
- 3041 N 39th Dr
- 3123 N 40th Ave
- 3108 N 40th Ave
- 3119 N 39th Dr
- 3907 W Earll Dr
- 3112 N 40th Ave
- 3034 N 39th Dr
- 3102 N 39th Ave