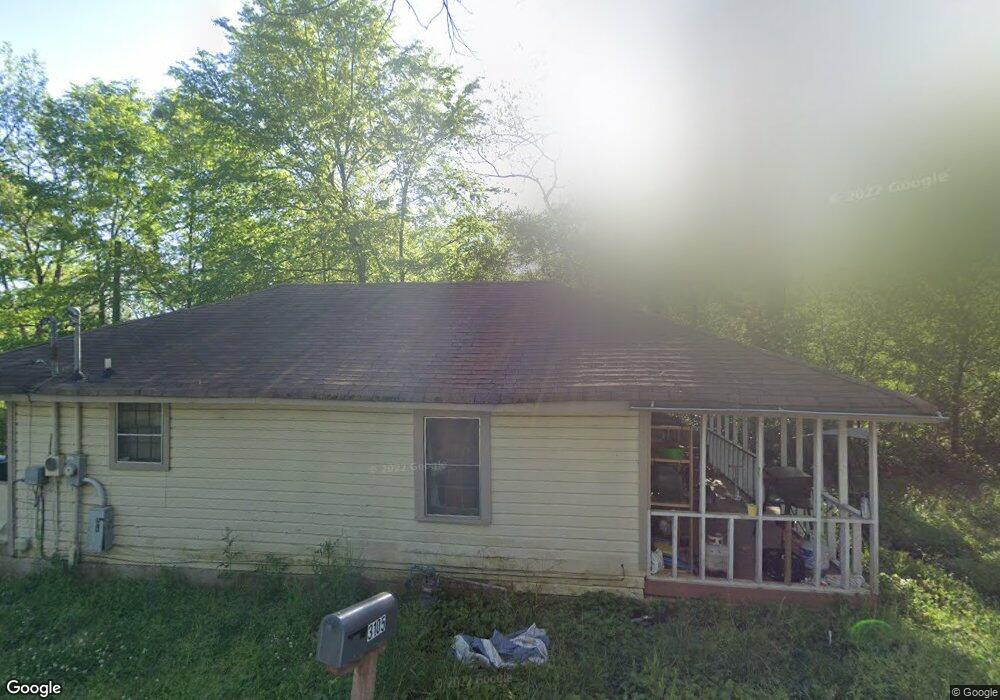
3105 Sanford St SW Covington, GA 30014
Estimated Value: $139,000 - $173,000
2
Beds
1
Bath
744
Sq Ft
$210/Sq Ft
Est. Value
About This Home
This home is located at 3105 Sanford St SW, Covington, GA 30014 and is currently estimated at $155,985, approximately $209 per square foot. 3105 Sanford St SW is a home located in Newton County with nearby schools including Porterdale Elementary School, Clements Middle School, and Eastside High School.
Ownership History
Date
Name
Owned For
Owner Type
Purchase Details
Closed on
Mar 9, 2023
Sold by
Shayevich Shauly
Bought by
Shauly Shayevich Llc
Current Estimated Value
Home Financials for this Owner
Home Financials are based on the most recent Mortgage that was taken out on this home.
Original Mortgage
$291,500
Outstanding Balance
$282,332
Interest Rate
6.12%
Mortgage Type
New Conventional
Estimated Equity
-$126,347
Purchase Details
Closed on
Apr 16, 2020
Sold by
Mock Properties I Lllp
Bought by
Shayevich Shauly
Purchase Details
Closed on
Jan 22, 2019
Sold by
Mock Properties I Lllp
Bought by
Sbre Property Investments Llc
Purchase Details
Closed on
Dec 4, 2018
Sold by
Sbre Property Investments Llc
Bought by
Mock Properties I Lllp
Purchase Details
Closed on
Jun 3, 2016
Sold by
Cobb Reta J
Bought by
Sbre Property Investments Llc
Create a Home Valuation Report for This Property
The Home Valuation Report is an in-depth analysis detailing your home's value as well as a comparison with similar homes in the area
Home Values in the Area
Average Home Value in this Area
Purchase History
| Date | Buyer | Sale Price | Title Company |
|---|---|---|---|
| Shauly Shayevich Llc | -- | -- | |
| Shayevich Shauly | $11,000 | -- | |
| Sbre Property Investments Llc | $11,000 | -- | |
| Mock Properties I Lllp | $11,000 | -- | |
| Sbre Property Investments Llc | $22,000 | -- |
Source: Public Records
Mortgage History
| Date | Status | Borrower | Loan Amount |
|---|---|---|---|
| Open | Shauly Shayevich Llc | $291,500 |
Source: Public Records
Tax History Compared to Growth
Tax History
| Year | Tax Paid | Tax Assessment Tax Assessment Total Assessment is a certain percentage of the fair market value that is determined by local assessors to be the total taxable value of land and additions on the property. | Land | Improvement |
|---|---|---|---|---|
| 2024 | $1,487 | $49,240 | $8,400 | $40,840 |
| 2023 | $1,461 | $44,960 | $4,000 | $40,960 |
| 2022 | $1,163 | $35,800 | $4,000 | $31,800 |
| 2021 | $917 | $25,240 | $6,800 | $18,440 |
| 2020 | $767 | $19,240 | $6,800 | $12,440 |
| 2019 | $733 | $18,040 | $6,800 | $11,240 |
| 2018 | $445 | $10,840 | $4,800 | $6,040 |
| 2017 | $352 | $8,560 | $3,600 | $4,960 |
| 2016 | $353 | $8,600 | $2,800 | $5,800 |
| 2015 | $278 | $6,760 | $2,268 | $4,492 |
| 2014 | $278 | $6,760 | $0 | $0 |
Source: Public Records
Map
Nearby Homes
- 0 S Highway 81 Unit 10621341
- 4105 Washington St SW
- 3107 Hendrix Cir SW
- 13806 Homer Ln
- 0 Old Covered Bridge Rd Unit 10618938
- 13709 Whitman Ln
- 2220 Lee St SW
- 2222 Lee St SW
- 4689 Sunrise Ridge
- 4561 Sunrise Ridge
- 4457 Sunrise Ridge
- 4485 Sunrise Ridge
- 4471 Sunrise Ridge
- 4645 Sunrise Ridge
- 4773 Foxhollow Trail
- 4629 Sunrise Ridge
- 4760 Foxhollow Trail
- 4654 Sunrise Ridge
- 4664 Sunrise Ridge
- 4764 Foxhollow Trail
- 0 Sanford St SW Unit 7578921
- 0 Sanford St SW
- 3103 Clark St SW
- 0 Clark St Unit 7578919
- 0 Clark St Unit 7032937
- 0 Clark St Unit 7578920
- 2195 Clark St SW
- 3109 Sanford St SW
- 3115 Sanford St SW
- 3121 Clark St SW
- 3136 Thelma St SW
- 3105 Clark St SW
- 3119 Sanford St SW
- 2193 Fowler St SW
- 3100 Washington St SW
- 3131 Clark St SW
- 3122 Alexander St SW
- 3135 Thelma St SW
- 3117 West St SW
- 2177 Usher St NW