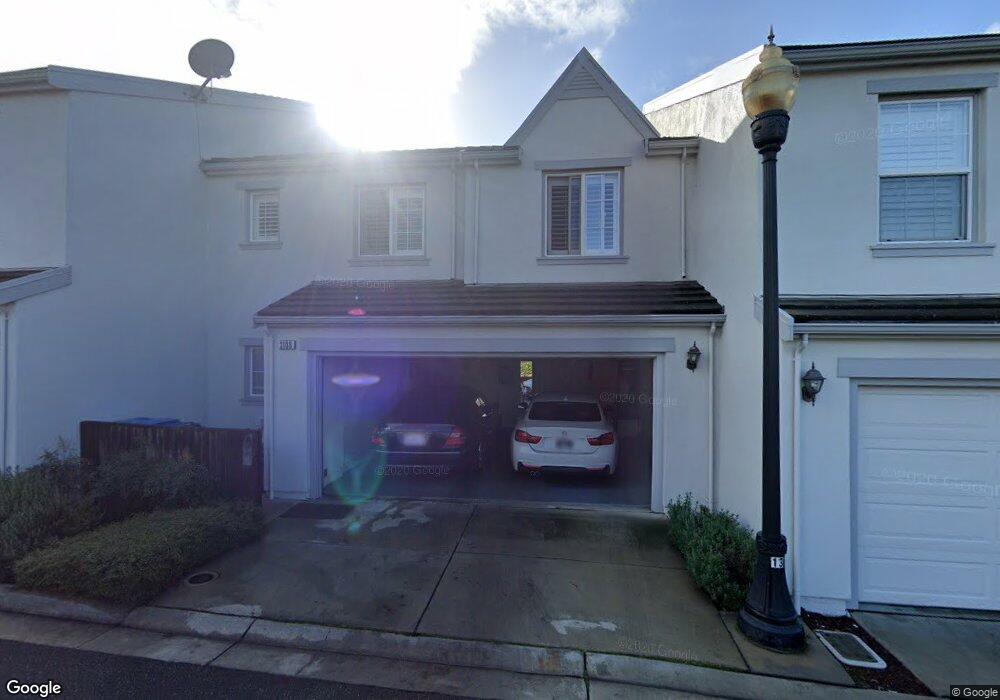
3108 Moncontour Ct San Jose, CA 95135
Mirassou Vineyards NeighborhoodEstimated Value: $1,162,214 - $1,387,000
3
Beds
3
Baths
1,377
Sq Ft
$912/Sq Ft
Est. Value
About This Home
This home is located at 3108 Moncontour Ct, San Jose, CA 95135 and is currently estimated at $1,255,554, approximately $911 per square foot. 3108 Moncontour Ct is a home located in Santa Clara County with nearby schools including Evergreen Elementary School, Chaboya Middle School, and Evergreen Valley High School.
Ownership History
Date
Name
Owned For
Owner Type
Purchase Details
Closed on
Dec 12, 2020
Sold by
Jeer Dilbag Singh and Jeer Kalbinder Kaur
Bought by
Jeer Dilbag Singh and Jeer Kalbinder Kaur
Current Estimated Value
Home Financials for this Owner
Home Financials are based on the most recent Mortgage that was taken out on this home.
Original Mortgage
$380,000
Outstanding Balance
$338,374
Interest Rate
2.71%
Mortgage Type
New Conventional
Estimated Equity
$917,180
Purchase Details
Closed on
Sep 2, 2014
Sold by
Jeer Dilbag Singh and Jeer Kalbinder Kaur
Bought by
The Dilbag Singh Jeer & Kalbinder Kaur J and Kaur Jeer Kalbinder
Purchase Details
Closed on
Sep 15, 2000
Sold by
Shapell Industries Inc
Bought by
Jeer Dilbag Singh and Jeer Kalbinder K
Home Financials for this Owner
Home Financials are based on the most recent Mortgage that was taken out on this home.
Original Mortgage
$356,450
Interest Rate
7.62%
Create a Home Valuation Report for This Property
The Home Valuation Report is an in-depth analysis detailing your home's value as well as a comparison with similar homes in the area
Home Values in the Area
Average Home Value in this Area
Purchase History
| Date | Buyer | Sale Price | Title Company |
|---|---|---|---|
| Jeer Dilbag Singh | -- | Fidelity National Title Co | |
| Jeer Dilbag Singh | -- | Fidelity National Title Co | |
| The Dilbag Singh Jeer & Kalbinder Kaur J | -- | None Available | |
| Jeer Dilbag Singh | $446,000 | Chicago Title Co |
Source: Public Records
Mortgage History
| Date | Status | Borrower | Loan Amount |
|---|---|---|---|
| Open | Jeer Dilbag Singh | $380,000 | |
| Previous Owner | Jeer Dilbag Singh | $356,450 |
Source: Public Records
Tax History Compared to Growth
Tax History
| Year | Tax Paid | Tax Assessment Tax Assessment Total Assessment is a certain percentage of the fair market value that is determined by local assessors to be the total taxable value of land and additions on the property. | Land | Improvement |
|---|---|---|---|---|
| 2025 | $10,512 | $671,428 | $241,083 | $430,345 |
| 2024 | $10,512 | $658,263 | $236,356 | $421,907 |
| 2023 | $10,294 | $645,357 | $231,722 | $413,635 |
| 2022 | $10,223 | $632,704 | $227,179 | $405,525 |
| 2021 | $10,030 | $620,299 | $222,725 | $397,574 |
| 2020 | $9,605 | $613,940 | $220,442 | $393,498 |
| 2019 | $9,358 | $601,903 | $216,120 | $385,783 |
| 2018 | $9,249 | $590,102 | $211,883 | $378,219 |
| 2017 | $9,095 | $578,532 | $207,729 | $370,803 |
| 2016 | $8,680 | $567,189 | $203,656 | $363,533 |
| 2015 | $8,561 | $558,670 | $200,597 | $358,073 |
| 2014 | $7,889 | $547,727 | $196,668 | $351,059 |
Source: Public Records
Map
Nearby Homes
- 3114 Pinot Grigio Place
- 3198 Vintage Crest Dr
- 4072 Bouquet Park Ln
- 3948 Mosher Dr
- 3422 Glenprosen Ct
- 4117 Pinot Gris Way
- 3176 Arcola Ct
- 3430 Maroun Place
- 3508 Casabella Ct
- 4121 Horizon Ln
- 3145 Chillum Ct
- 3123 Oakgate Way
- 3947 Timberline Dr
- 3874 Forester Ct
- 3858 Evangelho Cir
- 3843 Yerba Buena Ave
- 3668 Summit Ridge Ct
- 3642 Jasmine Cir Unit 3203
- 2725 Los Altos Dr
- 4786-0 San Felipe Rd
- 3114 Moncontour Ct
- 3102 Moncontour Ct
- 3113 Ledoux Ct
- 3107 Ledoux Ct
- 3119 Ledoux Ct
- 3101 Ledoux Ct
- 3125 Ledoux Ct
- 3132 Moncontour Ct
- 3155 Moncontour Ct
- 3156 Ledoux Ct
- 3149 Moncontour Ct
- 3150 Ledoux Ct
- 3144 Ledoux Ct
- 3143 Moncontour Ct
- 3137 Moncontour Ct
- 3005 Ruby Ave
- 3138 Ledoux Ct
- 3131 Moncontour Ct
- 3013 Ruby Ave
- 3001 Ruby Ave