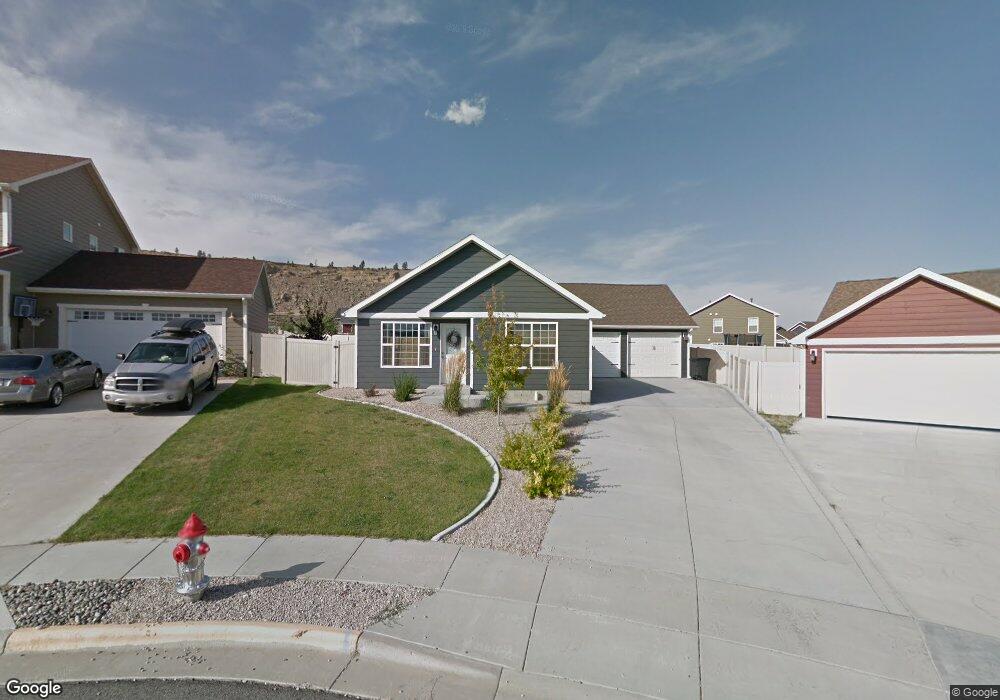
3109 Copper Ridge Place Billings, MT 59106
West Shiloh NeighborhoodEstimated Value: $383,000 - $427,000
3
Beds
2
Baths
1,372
Sq Ft
$292/Sq Ft
Est. Value
About This Home
This home is located at 3109 Copper Ridge Place, Billings, MT 59106 and is currently estimated at $400,767, approximately $292 per square foot. 3109 Copper Ridge Place is a home located in Yellowstone County with nearby schools including Boulder School, Ben Steele Middle School, and Billings West High School.
Ownership History
Date
Name
Owned For
Owner Type
Purchase Details
Closed on
Sep 29, 2016
Sold by
Hendrickson Amy B
Bought by
Lundeen Russel L and Lundeen Valerie M
Current Estimated Value
Home Financials for this Owner
Home Financials are based on the most recent Mortgage that was taken out on this home.
Original Mortgage
$218,660
Outstanding Balance
$174,120
Interest Rate
3.25%
Mortgage Type
FHA
Estimated Equity
$226,647
Purchase Details
Closed on
Mar 21, 2012
Sold by
Oakland Home Builders Corporation
Bought by
Hendrickson Amy B
Home Financials for this Owner
Home Financials are based on the most recent Mortgage that was taken out on this home.
Original Mortgage
$188,594
Interest Rate
3.75%
Mortgage Type
FHA
Purchase Details
Closed on
Nov 7, 2011
Sold by
Cooper Ridge Development Corporation
Bought by
Oakland Home Builders Corporation
Create a Home Valuation Report for This Property
The Home Valuation Report is an in-depth analysis detailing your home's value as well as a comparison with similar homes in the area
Home Values in the Area
Average Home Value in this Area
Purchase History
| Date | Buyer | Sale Price | Title Company |
|---|---|---|---|
| Lundeen Russel L | -- | American Title & Escrow | |
| Hendrickson Amy B | -- | Chicago Title | |
| Oakland Home Builders Corporation | -- | Chicago Title |
Source: Public Records
Mortgage History
| Date | Status | Borrower | Loan Amount |
|---|---|---|---|
| Open | Lundeen Russel L | $218,660 | |
| Previous Owner | Hendrickson Amy B | $188,594 |
Source: Public Records
Tax History Compared to Growth
Tax History
| Year | Tax Paid | Tax Assessment Tax Assessment Total Assessment is a certain percentage of the fair market value that is determined by local assessors to be the total taxable value of land and additions on the property. | Land | Improvement |
|---|---|---|---|---|
| 2025 | $3,491 | $362,800 | $75,825 | $286,975 |
| 2024 | $3,491 | $326,200 | $65,826 | $260,374 |
| 2023 | $3,445 | $326,200 | $65,826 | $260,374 |
| 2022 | $2,958 | $241,400 | $61,127 | $180,273 |
| 2021 | $2,733 | $241,400 | $0 | $0 |
| 2020 | $2,824 | $241,000 | $0 | $0 |
| 2019 | $2,710 | $241,000 | $0 | $0 |
| 2018 | $2,706 | $216,600 | $0 | $0 |
| 2017 | $2,005 | $216,600 | $0 | $0 |
| 2016 | $2,524 | $214,400 | $0 | $0 |
| 2015 | $2,459 | $214,400 | $0 | $0 |
| 2014 | $2,327 | $106,848 | $0 | $0 |
Source: Public Records
Map
Nearby Homes
- 3111 Amelia Cir
- 3136 Amelia Cir
- 3070 Western Bluffs Blvd
- 2924 Golden Acres Dr
- 6730 Cove Creek Dr
- 3005 Golden Acres Dr
- 1226 Buffalo Crossing Dr
- 3027 Golden Acres Dr
- Lot 8 Graphite Dr
- 637 Willow Branch Rd
- 635 Willow Branch Rd
- 6424 Southern Bluffs Ln
- 6862 Copper Ridge Loop
- 6838 Copper Ridge Loop
- 6433 Southern Bluffs Ln
- 4703 Laila
- 2981 W Copper Ridge Loop
- 6389 Signal Peak Ave
- 6325 Beckville Ln
- 2933 W Copper Ridge Loop
- 3113 Copper Ridge Place
- 3105 Copper Ridge Place
- 3120 Amelia Cir
- 3124 Amelia Cir
- 3110 Copper Ridge Place
- 3465 Lucky Penny Ln
- 3116 Amelia Cir
- 3103 E Copper Ridge Loop
- 3477 Lucky Penny Ln
- 3110 Amelia Cir
- 3106 Copper Ridge Place
- 3108 Amelia Cir
- 3103 Copper Ridge Place
- 3101 E Copper Ridge Loop
- 3105 E Copper Ridge Loop
- 3102 Amelia Cir
- 3128 Amelia Cir
- 3453 Lucky Penny Ln
- 3107 E Copper Ridge Loop
- 3464 Lucky Penny Ln