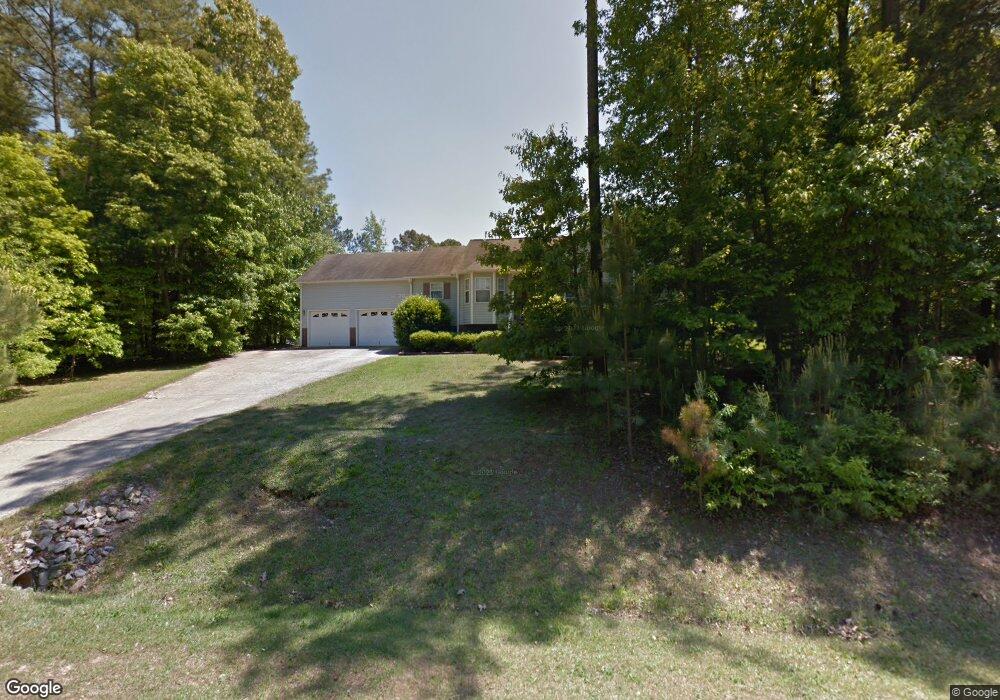
3109 Eric St Willow Spring, NC 27592
Estimated Value: $331,000 - $338,000
3
Beds
2
Baths
1,580
Sq Ft
$213/Sq Ft
Est. Value
About This Home
This home is located at 3109 Eric St, Willow Spring, NC 27592 and is currently estimated at $335,769, approximately $212 per square foot. 3109 Eric St is a home located in Wake County with nearby schools including Banks Road Elementary School and West Lake Middle.
Ownership History
Date
Name
Owned For
Owner Type
Purchase Details
Closed on
Jun 15, 2006
Sold by
Wilkins Ernest R
Bought by
Fletcher Dennis and Fletcher Phadra Tinita
Current Estimated Value
Home Financials for this Owner
Home Financials are based on the most recent Mortgage that was taken out on this home.
Original Mortgage
$147,285
Outstanding Balance
$86,300
Interest Rate
6.51%
Mortgage Type
FHA
Estimated Equity
$249,469
Purchase Details
Closed on
Jan 10, 2005
Sold by
Day Martin S and Day Francine S
Bought by
Wilkins Ernest R
Purchase Details
Closed on
Jul 31, 1998
Sold by
Comfort Homes Inc
Bought by
Day Martin S and Day Francine W
Home Financials for this Owner
Home Financials are based on the most recent Mortgage that was taken out on this home.
Original Mortgage
$144,600
Interest Rate
6.94%
Mortgage Type
VA
Create a Home Valuation Report for This Property
The Home Valuation Report is an in-depth analysis detailing your home's value as well as a comparison with similar homes in the area
Home Values in the Area
Average Home Value in this Area
Purchase History
| Date | Buyer | Sale Price | Title Company |
|---|---|---|---|
| Fletcher Dennis | $148,500 | None Available | |
| Wilkins Ernest R | -- | -- | |
| Day Martin S | $140,500 | -- |
Source: Public Records
Mortgage History
| Date | Status | Borrower | Loan Amount |
|---|---|---|---|
| Open | Fletcher Dennis | $147,285 | |
| Previous Owner | Day Martin S | $144,600 |
Source: Public Records
Tax History
| Year | Tax Paid | Tax Assessment Tax Assessment Total Assessment is a certain percentage of the fair market value that is determined by local assessors to be the total taxable value of land and additions on the property. | Land | Improvement |
|---|---|---|---|---|
| 2025 | $2,273 | $352,208 | $90,000 | $262,208 |
| 2024 | $2,207 | $352,208 | $90,000 | $262,208 |
Source: Public Records
Map
Nearby Homes
- 6304 Walnut Glen Dr
- 1636 Middle Ridge Dr
- 6512 Blalock Forest Dr
- 1425 Tawny View Ln
- 1417 Pleasant Quail Ct
- 1133 Farmers Branch Rd
- 1305 Tawny View Ln
- 3748 Norman Blalock Rd
- 6521 Camellia Creek Dr
- 1104 Taylor Farm Rd
- 5904 Dahlberg Dr
- 936 Elbridge Dr
- 1117 Leach St
- 7308 Messenger Dr
- 10601 Fanny Brown Rd
- 1060 Azalea Garden Cir
- 1217 Azalea Garden Cir
- 2015 Stone Pasture Rd
- 1000 Creek Front Ct
- 821 Comice Pear Way
- 6222 Walnut Glen Dr
- 6226 Walnut Glen Dr
- 3101 Eric St
- 3113 Eric St
- 3108 Eric St
- 6218 Walnut Glen Dr
- 6230 Walnut Glen Dr
- 6210 Walnut Glen Dr
- 3112 Eric St
- 6300 Walnut Glen Dr
- 3117 Eric St
- 6126 Walnut Glen Dr
- 6229 Walnut Glen Dr
- 6205 Walnut Glen Dr
- 6221 Walnut Glen Dr
- 6225 Walnut Glen Dr
- 6213 Walnut Glen Dr
- 3116 Eric St
- 3125 Eric St
- 6209 Walnut Glen Dr
Your Personal Tour Guide
Ask me questions while you tour the home.