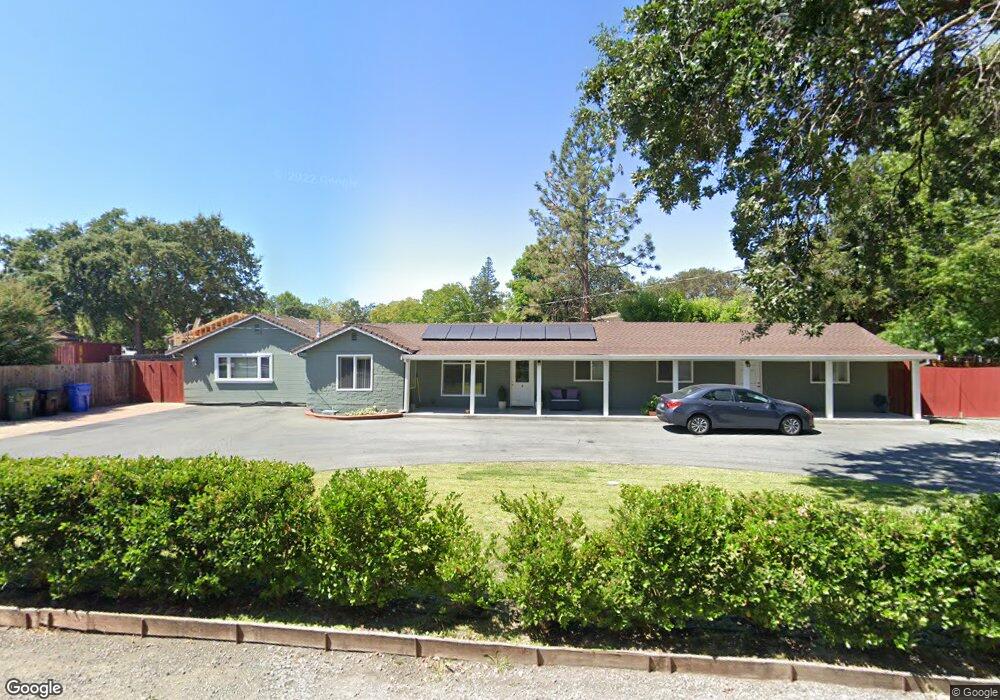
3109 Manor Ave Walnut Creek, CA 94597
Larkey Park NeighborhoodEstimated Value: $938,000 - $1,077,000
2
Beds
1
Bath
1,291
Sq Ft
$765/Sq Ft
Est. Value
About This Home
This home is located at 3109 Manor Ave, Walnut Creek, CA 94597 and is currently estimated at $988,035, approximately $765 per square foot. 3109 Manor Ave is a home located in Contra Costa County with nearby schools including Pleasant Hill Elementary School, Pleasant Hill Middle School, and College Park High School.
Ownership History
Date
Name
Owned For
Owner Type
Purchase Details
Closed on
Apr 14, 2021
Sold by
Riaz Farhana
Bought by
Riaz Farhana and The Riaz 2021 Revocable Trust
Current Estimated Value
Purchase Details
Closed on
Apr 19, 2012
Sold by
Bank Of America Na
Bought by
Riaz Farhana
Home Financials for this Owner
Home Financials are based on the most recent Mortgage that was taken out on this home.
Original Mortgage
$248,000
Outstanding Balance
$170,729
Interest Rate
3.84%
Mortgage Type
New Conventional
Estimated Equity
$817,306
Purchase Details
Closed on
Nov 28, 2011
Sold by
Colchico Joseph
Bought by
Bank Of America Na
Purchase Details
Closed on
Jul 18, 2000
Sold by
Alireza Akhbari
Bought by
Colchico Joseph
Home Financials for this Owner
Home Financials are based on the most recent Mortgage that was taken out on this home.
Original Mortgage
$280,000
Interest Rate
8.37%
Mortgage Type
Purchase Money Mortgage
Create a Home Valuation Report for This Property
The Home Valuation Report is an in-depth analysis detailing your home's value as well as a comparison with similar homes in the area
Home Values in the Area
Average Home Value in this Area
Purchase History
| Date | Buyer | Sale Price | Title Company |
|---|---|---|---|
| Riaz Farhana | -- | None Available | |
| Riaz Farhana | $310,000 | Chicago Title Company | |
| Bank Of America Na | $299,250 | Landsafe Title | |
| Colchico Joseph | $280,000 | First California Title Compa | |
| Akhbari Alireza | -- | First California Title Compa |
Source: Public Records
Mortgage History
| Date | Status | Borrower | Loan Amount |
|---|---|---|---|
| Open | Riaz Farhana | $248,000 | |
| Previous Owner | Colchico Joseph | $280,000 |
Source: Public Records
Tax History Compared to Growth
Tax History
| Year | Tax Paid | Tax Assessment Tax Assessment Total Assessment is a certain percentage of the fair market value that is determined by local assessors to be the total taxable value of land and additions on the property. | Land | Improvement |
|---|---|---|---|---|
| 2025 | $4,985 | $389,366 | $339,131 | $50,235 |
| 2024 | $4,985 | $381,732 | $332,482 | $49,250 |
| 2023 | $4,895 | $374,248 | $325,963 | $48,285 |
| 2022 | $4,851 | $366,911 | $319,572 | $47,339 |
| 2021 | $4,736 | $359,717 | $313,306 | $46,411 |
| 2019 | $4,609 | $349,050 | $304,014 | $45,036 |
| 2018 | $4,439 | $342,206 | $298,053 | $44,153 |
| 2017 | $4,289 | $335,497 | $292,209 | $43,288 |
| 2016 | $4,174 | $328,920 | $286,480 | $42,440 |
| 2015 | $4,129 | $323,980 | $282,177 | $41,803 |
| 2014 | $4,061 | $317,635 | $276,650 | $40,985 |
Source: Public Records
Map
Nearby Homes
- 155 Via Del Sol
- 1590 Sunnyvale Ave Unit 31
- 1089 Wesley Ct Unit 8
- 105 Laurel Oak Dr
- 53 Monte Cresta Ave
- 1064 Wesley Ct Unit 2
- 1539 Geary Rd Unit C
- 218 Avant Place
- 1933 Oak Park Blvd
- 256 Douglas Ln
- 1015 Pleasant Valley Dr
- 406 Ivy Ln
- 1007 Pleasant Valley Dr
- 26 Warhol Way
- 510 Ashton Way
- 404 Beatrice Rd Unit 3
- 3193 Wayside Plaza Unit 23
- 186 Oak Cir
- 3183 Wayside Plaza Unit 308
- 3183 Wayside Plaza Unit 319
- 3113 Manor Ave
- 223 Via Del Sol
- 3117 Manor Ave
- 235 Via Del Sol
- 3108 Manor Ave
- 3125 Manor Ave
- 3116 Manor Ave
- 3100 Manor Ave
- 3133 Manor Ave
- 2916 Eccleston Ave
- 2924 Eccleston Ave
- 216 Via Del Sol
- 2908 Eccleston Ave
- 2932 Eccleston Ave
- 3124 Manor Ave
- 222 Via Del Sol
- 3141 Manor Ave
- 198 Via Del Sol
- 2832 Eccleston Ave
- 230 Via Del Sol