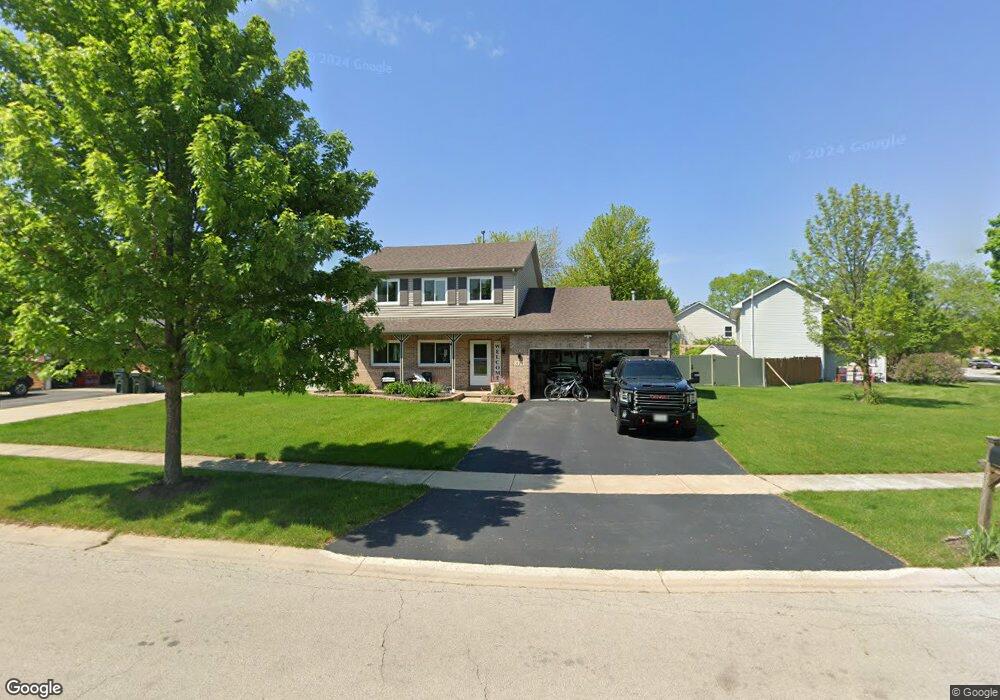
311 Beaver Crossing Unit 3 Oswego, IL 60543
Northwest Oswego NeighborhoodEstimated Value: $351,999 - $364,000
3
Beds
2
Baths
1,795
Sq Ft
$199/Sq Ft
Est. Value
About This Home
This home is located at 311 Beaver Crossing Unit 3, Oswego, IL 60543 and is currently estimated at $356,750, approximately $198 per square foot. 311 Beaver Crossing Unit 3 is a home located in Kendall County with nearby schools including Fox Chase Elementary School, Traughber Junior High School, and Oswego High School.
Ownership History
Date
Name
Owned For
Owner Type
Purchase Details
Closed on
Jul 21, 2021
Sold by
Fenske Jon B and Fenske Cheryl L
Bought by
Fenske Jon B and Fenske Cheryl L
Current Estimated Value
Purchase Details
Closed on
Feb 17, 1999
Sold by
Rose Kenneth J and Rose Deborah L
Bought by
Fenske Jon B and Fenske Cheryl L
Home Financials for this Owner
Home Financials are based on the most recent Mortgage that was taken out on this home.
Original Mortgage
$150,460
Outstanding Balance
$36,164
Interest Rate
6.92%
Mortgage Type
FHA
Estimated Equity
$320,586
Purchase Details
Closed on
Nov 7, 1994
Bought by
Rose Kenneth J and Rose Deborah L
Create a Home Valuation Report for This Property
The Home Valuation Report is an in-depth analysis detailing your home's value as well as a comparison with similar homes in the area
Home Values in the Area
Average Home Value in this Area
Purchase History
| Date | Buyer | Sale Price | Title Company |
|---|---|---|---|
| Fenske Jon B | -- | Attorney | |
| Fenske Jon B | $151,500 | First American Title Ins Co | |
| Rose Kenneth J | $138,600 | -- |
Source: Public Records
Mortgage History
| Date | Status | Borrower | Loan Amount |
|---|---|---|---|
| Open | Fenske Jon B | $150,460 | |
| Closed | Rose Kenneth J | -- |
Source: Public Records
Tax History Compared to Growth
Tax History
| Year | Tax Paid | Tax Assessment Tax Assessment Total Assessment is a certain percentage of the fair market value that is determined by local assessors to be the total taxable value of land and additions on the property. | Land | Improvement |
|---|---|---|---|---|
| 2024 | $7,211 | $95,609 | $14,485 | $81,124 |
| 2023 | $6,530 | $85,365 | $12,933 | $72,432 |
| 2022 | $6,530 | $78,316 | $11,865 | $66,451 |
| 2021 | $6,417 | $74,587 | $11,300 | $63,287 |
| 2020 | $6,411 | $73,848 | $11,188 | $62,660 |
| 2019 | $6,513 | $73,848 | $11,188 | $62,660 |
| 2018 | $6,258 | $72,607 | $11,000 | $61,607 |
| 2017 | $5,858 | $63,143 | $6,623 | $56,520 |
| 2016 | $5,887 | $62,595 | $17,007 | $45,588 |
| 2015 | $5,497 | $56,392 | $15,322 | $41,070 |
| 2014 | -- | $53,200 | $14,455 | $38,745 |
| 2013 | -- | $53,737 | $14,601 | $39,136 |
Source: Public Records
Map
Nearby Homes
- 602 Clearwater Ct Unit 2
- 608 Clearwater Ct
- 409 Fawn Dr
- 338 Millstream Ln Unit 1
- 173 Dolores St
- 403 Lake Ct
- 435 Fawn Dr
- 505 Parkland Ct
- 102 Mary St
- 1721 State Route 31
- 125 Presidential Blvd Unit 3248
- 2100 Light Rd Unit 109
- 514 Bentson St
- 411 Bayberry Dr
- 2110 State Route 31
- 133 River Mist Dr Unit 3
- 238 Willowwood Dr
- 156 River Mist Dr
- 2350 State Route 31
- 5055 U S 34
- 305 Beaver Crossing
- 313 Beaver Crossing
- 404 Beaver Ct Unit 3
- 303 Beaver Crossing
- 312 Beaver Crossing Unit 3
- 314 Beaver Crossing
- 406 Beaver Ct
- 310 Beaver Crossing
- 316 Beaver Crossing Unit 3
- 263 Fox Chase Dr N Unit 3
- 261 Fox Chase Dr N
- 304 Beaver Crossing
- 401 Beaver Ct
- 403 Beaver Ct
- 408 Beaver Ct
- 318 Beaver Crossing
- 308 Beaver Crossing
- 405 Beaver Ct
- 306 Beaver Crossing Unit 3
- 265 Fox Chase Dr N