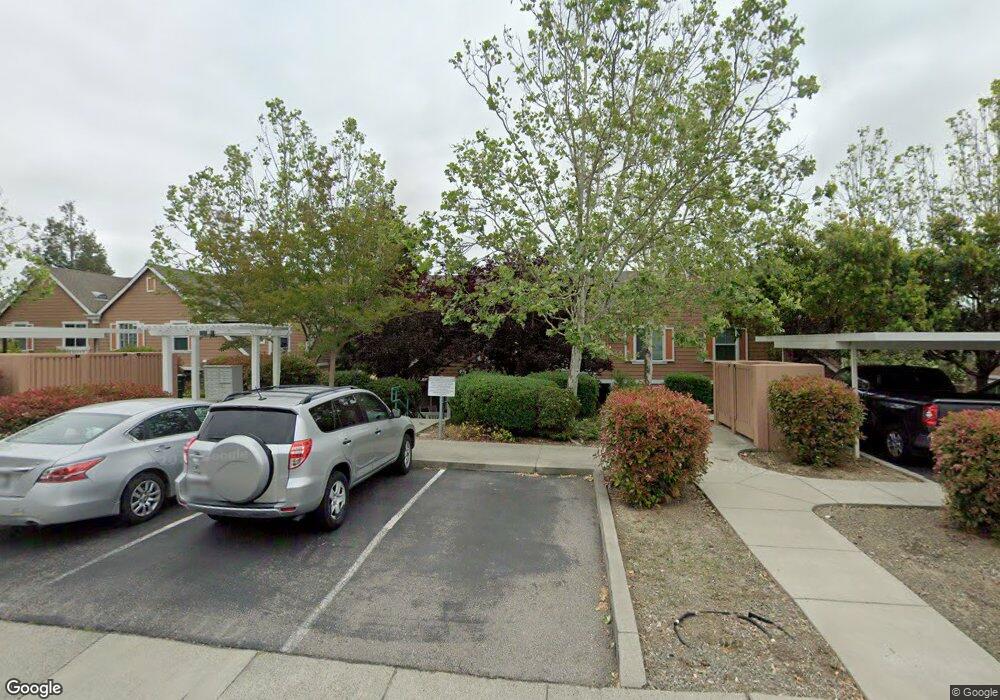
311 Bolling Cir Unit 330 Novato, CA 94949
Hamilton NeighborhoodEstimated Value: $482,000 - $728,000
3
Beds
3
Baths
1,461
Sq Ft
$412/Sq Ft
Est. Value
About This Home
This home is located at 311 Bolling Cir Unit 330, Novato, CA 94949 and is currently estimated at $602,111, approximately $412 per square foot. 311 Bolling Cir Unit 330 is a home located in Marin County with nearby schools including Hamilton Meadow Park School, Novato High School, and Novato Charter School.
Ownership History
Date
Name
Owned For
Owner Type
Purchase Details
Closed on
Feb 1, 2021
Sold by
Riggs Pamela Anne and Manning Pamela A
Bought by
Riggs Pamela Anne
Current Estimated Value
Home Financials for this Owner
Home Financials are based on the most recent Mortgage that was taken out on this home.
Original Mortgage
$346,900
Outstanding Balance
$309,725
Interest Rate
2.6%
Mortgage Type
New Conventional
Estimated Equity
$292,386
Purchase Details
Closed on
Mar 13, 2006
Sold by
Novato Community Partners Llc
Bought by
Manning Pamela A
Home Financials for this Owner
Home Financials are based on the most recent Mortgage that was taken out on this home.
Original Mortgage
$378,300
Interest Rate
6.35%
Mortgage Type
Unknown
Create a Home Valuation Report for This Property
The Home Valuation Report is an in-depth analysis detailing your home's value as well as a comparison with similar homes in the area
Home Values in the Area
Average Home Value in this Area
Purchase History
| Date | Buyer | Sale Price | Title Company |
|---|---|---|---|
| Riggs Pamela Anne | -- | Fidelity National Title Co | |
| Riggs Pamela Anne | -- | Fidelity National Title Co | |
| Manning Pamela A | $390,000 | Cal Land Title |
Source: Public Records
Mortgage History
| Date | Status | Borrower | Loan Amount |
|---|---|---|---|
| Open | Riggs Pamela Anne | $346,900 | |
| Closed | Manning Pamela A | $378,300 |
Source: Public Records
Tax History Compared to Growth
Tax History
| Year | Tax Paid | Tax Assessment Tax Assessment Total Assessment is a certain percentage of the fair market value that is determined by local assessors to be the total taxable value of land and additions on the property. | Land | Improvement |
|---|---|---|---|---|
| 2025 | $7,275 | $532,918 | $266,459 | $266,459 |
| 2024 | $7,275 | $522,470 | $261,235 | $261,235 |
| 2023 | $7,107 | $512,228 | $256,114 | $256,114 |
| 2022 | $6,942 | $502,186 | $251,093 | $251,093 |
| 2021 | $6,932 | $492,342 | $246,171 | $246,171 |
| 2020 | $6,828 | $487,296 | $243,648 | $243,648 |
| 2019 | $6,587 | $477,746 | $238,873 | $238,873 |
| 2018 | $6,488 | $468,382 | $234,191 | $234,191 |
| 2017 | $6,369 | $459,200 | $229,600 | $229,600 |
| 2016 | $5,820 | $440,505 | $220,253 | $220,252 |
| 2015 | $5,080 | $375,000 | $187,500 | $187,500 |
| 2014 | $4,891 | $360,000 | $180,000 | $180,000 |
Source: Public Records
Map
Nearby Homes
- 402 Bolling Cir
- 31 Crissy Place Unit 124
- 23 Greenham Ct
- 3 Marblehead Ln
- 27 Arnold Dr
- 56 Club View Dr
- 21 Lovejoy Way
- 10 Fallen Leaf Way
- 63 Gann Way
- 28 Lovejoy Way
- 62 Holliday Dr
- 40 Lovejoy Way
- 43 Ferdinand Way
- 4 Cielo Ln Unit 3
- 195 Los Robles Rd
- 154 Sandpiper Ct
- 5 Charmaine Ct
- 10 Josefa Ct
- 106 Posada Del Sol
- 122 Posada Del Sol
- 313 Bolling Cir
- 295 Bolling Cir Unit 329
- 315 Bolling Cir
- 293 Bolling Cir
- 291 Bolling Cir Unit 327
- 331 Bolling Cir Unit 333
- 333 Bolling Cir
- 275 Bolling Cir
- 335 Bolling Cir
- 273 Bolling Cir Unit 325
- 284 Bolling Cir Unit 308
- 271 Bolling Cir Unit 324
- 282 Bolling Cir Unit 309
- 351 Bolling Cir
- 264 Bolling Cir Unit 310
- 262 Bolling Cir Unit 311
- 353 Bolling Cir Unit 337
- 355 Bolling Cir Unit 338
- 255 Bolling Cir Unit 323
- 357 Bolling Cir Unit 339