Estimated Value: $43,584
Studio
11
Baths
450
Sq Ft
$97/Sq Ft
Est. Value
About This Home
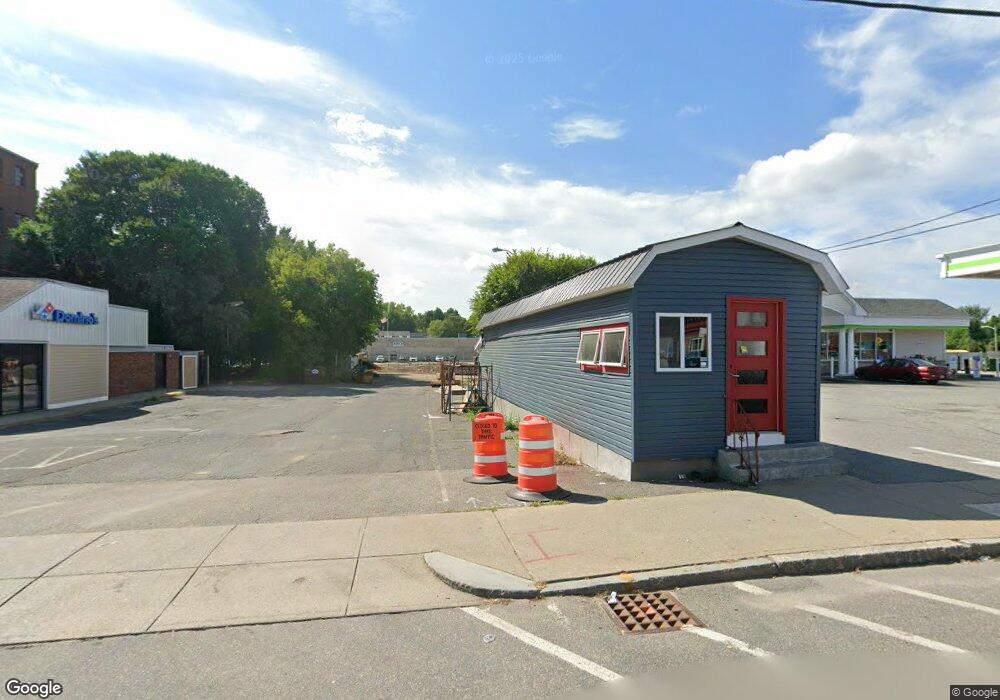
This home is located at 311 Main St, Athol, MA 01331 and is currently estimated at $43,584, approximately $96 per square foot. 311 Main St is a home located in Worcester County with nearby schools including Athol High School.
Ownership History
Date
Name
Owned For
Owner Type
Purchase Details
Closed on
Nov 22, 2023
Sold by
Main St Diner Rt and Sinker
Bought by
Miller Jeffrey and Miller Kimberly
Current Estimated Value
Purchase Details
Closed on
Aug 20, 2010
Sold by
Gray Tr Eric D and Reed Yvette A
Bought by
Main Street Diner Rt and Avila
Purchase Details
Closed on
May 11, 2001
Sold by
Blanchard Bruce M and Blanchard Lori J
Bought by
Main Street Diner Rt and Gray
Home Financials for this Owner
Home Financials are based on the most recent Mortgage that was taken out on this home.
Original Mortgage
$76,000
Interest Rate
6.88%
Mortgage Type
Commercial
Purchase Details
Closed on
Jul 24, 1991
Sold by
Elliott Rita M
Bought by
Blanchard Bruce M and Blanchard Lori J
Home Financials for this Owner
Home Financials are based on the most recent Mortgage that was taken out on this home.
Original Mortgage
$40,600
Interest Rate
9.58%
Mortgage Type
Commercial
Create a Home Valuation Report for This Property
The Home Valuation Report is an in-depth analysis detailing your home's value as well as a comparison with similar homes in the area
Home Values in the Area
Average Home Value in this Area
Purchase History
| Date | Buyer | Sale Price | Title Company |
|---|---|---|---|
| Miller Jeffrey | $37,500 | None Available | |
| Main Street Diner Rt | $90,000 | -- | |
| Main Street Diner Rt | $90,000 | -- | |
| Main Street Diner Rt | $80,000 | -- | |
| Main Street Diner Rt | $80,000 | -- | |
| Blanchard Bruce M | $58,000 | -- | |
| Blanchard Bruce M | $58,000 | -- |
Source: Public Records
Mortgage History
| Date | Status | Borrower | Loan Amount |
|---|---|---|---|
| Previous Owner | Blanchard Bruce M | $76,000 | |
| Previous Owner | Blanchard Bruce M | $40,600 |
Source: Public Records
Tax History
| Year | Tax Paid | Tax Assessment Tax Assessment Total Assessment is a certain percentage of the fair market value that is determined by local assessors to be the total taxable value of land and additions on the property. | Land | Improvement |
|---|---|---|---|---|
| 2025 | $423 | $33,300 | $20,100 | $13,200 |
| 2024 | $1,478 | $115,200 | $76,600 | $38,600 |
| 2023 | $1,321 | $94,100 | $55,500 | $38,600 |
| 2022 | $1,510 | $94,100 | $55,500 | $38,600 |
| 2021 | $1,385 | $78,400 | $35,600 | $42,800 |
| 2020 | $1,347 | $78,400 | $35,600 | $42,800 |
| 2019 | $1,368 | $78,400 | $35,600 | $42,800 |
| 2018 | $1,466 | $74,900 | $32,100 | $42,800 |
| 2017 | $1,528 | $74,900 | $32,100 | $42,800 |
| 2016 | $1,303 | $65,700 | $28,700 | $37,000 |
| 2015 | $1,250 | $65,700 | $28,700 | $37,000 |
| 2014 | $1,211 | $65,700 | $28,700 | $37,000 |
Source: Public Records
Map
Nearby Homes
Your Personal Tour Guide
Ask me questions while you tour the home.