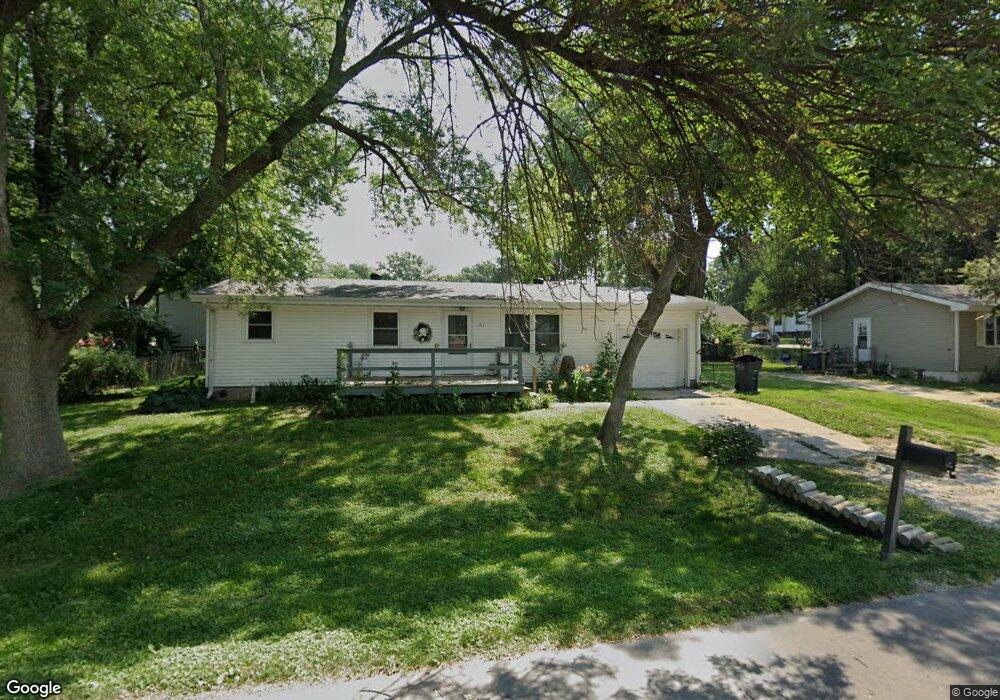
311 N Allen St Carson, IA 51525
Estimated Value: $159,000 - $178,732
3
Beds
1
Bath
960
Sq Ft
$173/Sq Ft
Est. Value
About This Home
This home is located at 311 N Allen St, Carson, IA 51525 and is currently estimated at $165,933, approximately $172 per square foot. 311 N Allen St is a home located in Pottawattamie County with nearby schools including Riverside Elementary School, Carson Elementary School, and Riverside Community High School.
Ownership History
Date
Name
Owned For
Owner Type
Purchase Details
Closed on
Sep 1, 2024
Sold by
Knoke Leah J and Boruff Leah J
Bought by
Boruff Leah J
Current Estimated Value
Purchase Details
Closed on
Apr 10, 2009
Sold by
Patrick Joann E
Bought by
Knoke Leah J
Home Financials for this Owner
Home Financials are based on the most recent Mortgage that was taken out on this home.
Original Mortgage
$68,732
Interest Rate
5.19%
Mortgage Type
FHA
Purchase Details
Closed on
Nov 20, 2008
Sold by
Citifinancial Inc
Bought by
Patrick Joann E
Create a Home Valuation Report for This Property
The Home Valuation Report is an in-depth analysis detailing your home's value as well as a comparison with similar homes in the area
Purchase History
| Date | Buyer | Sale Price | Title Company |
|---|---|---|---|
| Boruff Leah J | -- | None Listed On Document | |
| Knoke Leah J | $70,000 | Omaha Title & Escrow Inc | |
| Patrick Joann E | $45,000 | None Available |
Source: Public Records
Mortgage History
| Date | Status | Borrower | Loan Amount |
|---|---|---|---|
| Previous Owner | Knoke Leah J | $68,732 |
Source: Public Records
Tax History
| Year | Tax Paid | Tax Assessment Tax Assessment Total Assessment is a certain percentage of the fair market value that is determined by local assessors to be the total taxable value of land and additions on the property. | Land | Improvement |
|---|---|---|---|---|
| 2025 | $2,130 | $160,000 | $16,900 | $143,100 |
| 2024 | $2,130 | $138,900 | $14,700 | $124,200 |
| 2023 | $2,158 | $138,900 | $14,700 | $124,200 |
| 2022 | $1,812 | $104,400 | $11,600 | $92,800 |
| 2021 | $2,774 | $104,400 | $11,600 | $92,800 |
| 2020 | $1,674 | $104,400 | $11,600 | $92,800 |
| 2019 | $1,752 | $90,000 | $10,517 | $79,483 |
| 2018 | $1,694 | $90,000 | $10,517 | $79,483 |
| 2017 | $1,428 | $74,600 | $10,517 | $64,083 |
| 2015 | $1,424 | $74,600 | $10,517 | $64,083 |
| 2014 | $1,422 | $74,600 | $10,517 | $64,083 |
Source: Public Records
Map
Nearby Homes
- Lot 11 Tibbles Addition St
- Lot 22 Tibbles Addition St
- Lot 18 Tibbles Addition St
- Lot 20 Tibbles Addition St
- Lot 21 Tibbles Addition St
- Lot 5 Tibbles Addition St
- 305 Washington St
- 226 N Commercial St
- TBD 00 400th St
- 21 Lot Tibbles Addition St
- 11 Lot Tibbles Addition
- 18 Lot Tibbles Addition St
- LOT 12 Grace St
- 39612 Iowa 92
- 5 Tibbles Addition St
- 22 Lot Tibbles Addition St
- 0000 Cottonwood Rd
- 20 Lot Tibbles Addition St
- 501 Dye St
- 124 Schueman Cul de Sac
Your Personal Tour Guide
Ask me questions while you tour the home.