Estimated Value: $66,000 - $380,000
3
Beds
1
Bath
1,441
Sq Ft
$116/Sq Ft
Est. Value
About This Home
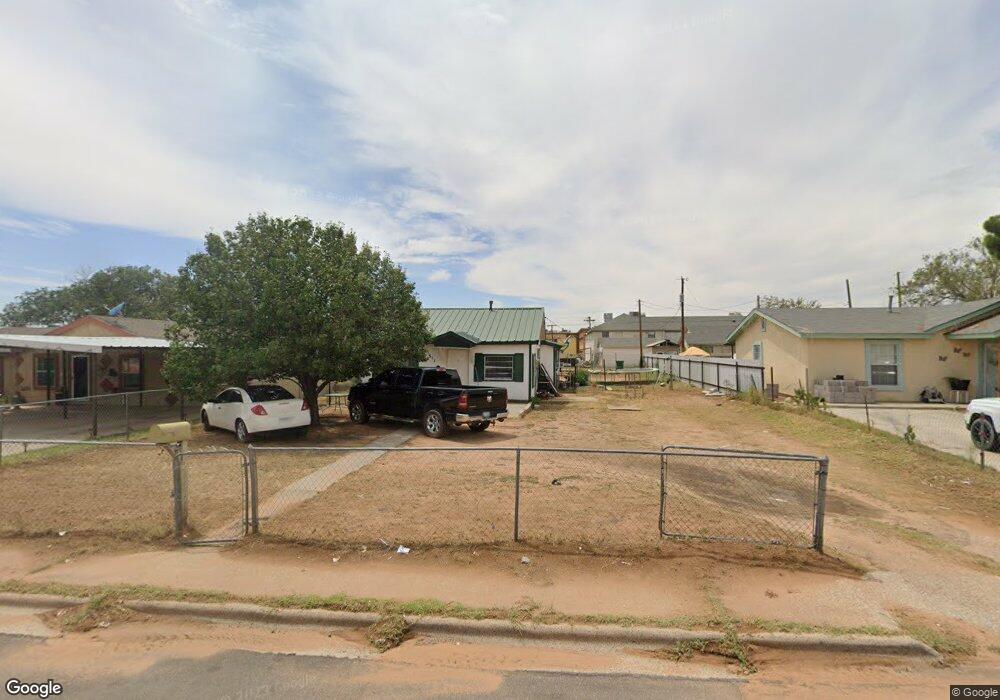
This home is located at 311 N Morris St, Hobbs, NM 88240 and is currently estimated at $167,586, approximately $116 per square foot. 311 N Morris St is a home located in Lea County with nearby schools including Will Rogers Elementary School, Houston Middle School, and Hobbs High School.
Ownership History
Date
Name
Owned For
Owner Type
Purchase Details
Closed on
Jan 27, 2023
Sold by
Navario Graci G
Bought by
Cardena Mirna and Valenzvela Israel
Current Estimated Value
Purchase Details
Closed on
Oct 7, 2019
Sold by
Navarro Gracie
Bought by
Valenzuela Israel and Cardona Mirna Arceli
Home Financials for this Owner
Home Financials are based on the most recent Mortgage that was taken out on this home.
Original Mortgage
$50,000
Interest Rate
3.5%
Mortgage Type
Land Contract Argmt. Of Sale
Purchase Details
Closed on
Aug 12, 2019
Sold by
Navarro Jose M and Navarro Joe
Bought by
Navarro Grocie
Home Financials for this Owner
Home Financials are based on the most recent Mortgage that was taken out on this home.
Original Mortgage
$50,000
Interest Rate
3.5%
Mortgage Type
Land Contract Argmt. Of Sale
Purchase Details
Closed on
Nov 3, 2014
Sold by
Sara B Sara B and Cisneros Alfonso
Bought by
Navarro Jose
Purchase Details
Closed on
Jun 28, 2013
Sold by
Cisneros Sara B
Bought by
Cisneros Sara B and Cisneros Alfonso
Create a Home Valuation Report for This Property
The Home Valuation Report is an in-depth analysis detailing your home's value as well as a comparison with similar homes in the area
Home Values in the Area
Average Home Value in this Area
Purchase History
| Date | Buyer | Sale Price | Title Company |
|---|---|---|---|
| Cardena Mirna | -- | None Listed On Document | |
| Valenzuela Israel | $32,000 | None Available | |
| Navarro Grocie | -- | None Available | |
| Navarro Jose | -- | -- | |
| Cisneros Sara B | -- | -- |
Source: Public Records
Mortgage History
| Date | Status | Borrower | Loan Amount |
|---|---|---|---|
| Previous Owner | Valenzuela Israel | $50,000 |
Source: Public Records
Tax History Compared to Growth
Tax History
| Year | Tax Paid | Tax Assessment Tax Assessment Total Assessment is a certain percentage of the fair market value that is determined by local assessors to be the total taxable value of land and additions on the property. | Land | Improvement |
|---|---|---|---|---|
| 2024 | $414 | $15,150 | $1,717 | $13,433 |
| 2023 | $407 | $14,709 | $1,667 | $13,042 |
| 2022 | $402 | $14,709 | $1,667 | $13,042 |
| 2021 | $401 | $14,709 | $1,667 | $13,042 |
| 2020 | $395 | $14,709 | $1,667 | $13,042 |
| 2019 | $217 | $8,209 | $667 | $7,542 |
| 2018 | $214 | $8,209 | $667 | $7,542 |
| 2017 | $227 | $24,627 | $2,001 | $22,626 |
| 2016 | $236 | $24,627 | $2,001 | $22,626 |
| 2015 | $216 | $24,627 | $2,001 | $22,626 |
| 2014 | -- | $24,627 | $2,001 | $22,626 |
Source: Public Records
Map
Nearby Homes
- 515 E Clinton St
- 200 S Avenue C
- 1221 E Dunnam St
- 827 Pinon Dr
- 126 S Marland Blvd
- 210 W Dunnam St
- 606 E Yucca Dr
- 1411 E Dunnam St
- 504 E Green Acres Dr
- 1114 E Sanger St
- 1604 E Dunn St
- TBD N Thorp St
- 303 E Permian Dr
- TBD N Marland Blvd
- 1011 N Linam St
- 512 S Mckinley St
- 920 E Llano Dr
- TBD E Midwest St
- TBD W Byers St
- 313 W Roxana St
- 317 N Morris St
- 309 N Morris St
- 321 N Morris St
- 303 N Morris St
- 601 E Snyder St
- 314 N Morris St
- 310 N Morris St
- 613 E Cain St
- 617 E Cain St
- 609 E Cain St
- 613 E Cain St
- 306 N Morris St
- 703 E Snyder St
- 618 E Snyder St
- 618 E Snyder St
- 615 E Cain St
- 604 E Snyder St
- 402 N Morris St
- 600 E Snyder St
- 602 E Snyder St