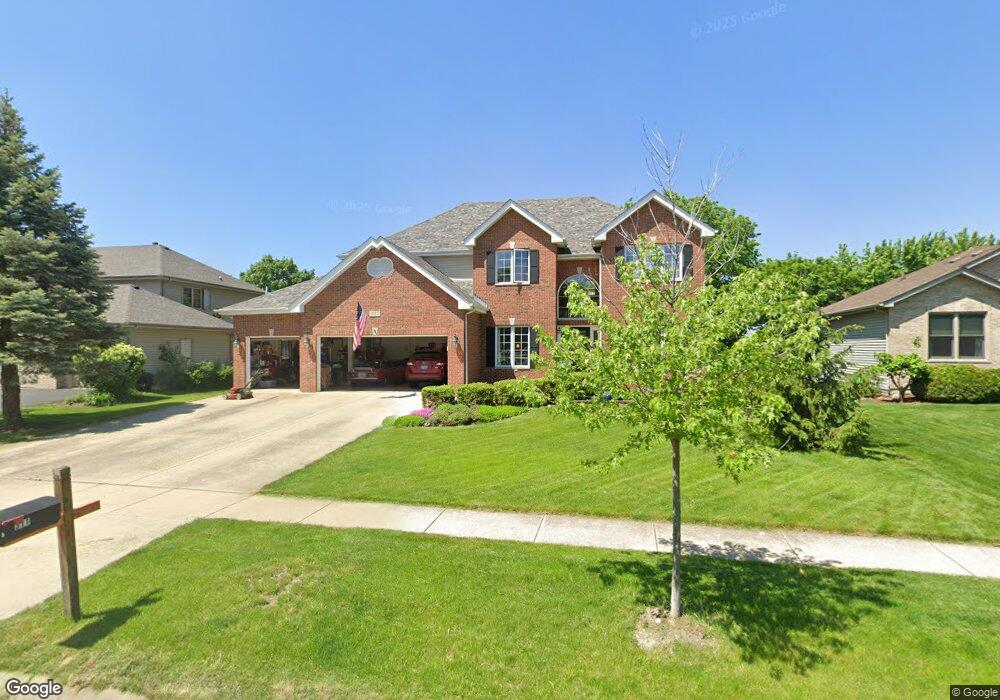
311 Prairieview Dr Oswego, IL 60543
South Oswego NeighborhoodEstimated Value: $530,861 - $587,000
4
Beds
4
Baths
3,036
Sq Ft
$184/Sq Ft
Est. Value
About This Home
This home is located at 311 Prairieview Dr, Oswego, IL 60543 and is currently estimated at $558,965, approximately $184 per square foot. 311 Prairieview Dr is a home located in Kendall County with nearby schools including Prairie Point Elementary School, Traughber Junior High School, and Oswego High School.
Ownership History
Date
Name
Owned For
Owner Type
Purchase Details
Closed on
May 12, 2011
Sold by
Jones David S and Jones Marnie K
Bought by
White Ronald N and White Shawn T
Current Estimated Value
Purchase Details
Closed on
Sep 30, 2009
Sold by
Plummer John and Plummer Jennifer
Bought by
Jones David S and Jones Marnie K
Home Financials for this Owner
Home Financials are based on the most recent Mortgage that was taken out on this home.
Original Mortgage
$275,000
Interest Rate
5.19%
Mortgage Type
New Conventional
Purchase Details
Closed on
Jun 8, 2003
Sold by
Castletown Homes Inc
Bought by
Plummer John and Plummer Jennifer
Home Financials for this Owner
Home Financials are based on the most recent Mortgage that was taken out on this home.
Original Mortgage
$247,500
Interest Rate
4.86%
Mortgage Type
Purchase Money Mortgage
Create a Home Valuation Report for This Property
The Home Valuation Report is an in-depth analysis detailing your home's value as well as a comparison with similar homes in the area
Home Values in the Area
Average Home Value in this Area
Purchase History
| Date | Buyer | Sale Price | Title Company |
|---|---|---|---|
| White Ronald N | $325,000 | None Available | |
| Jones David S | $350,000 | Chicago Metro Title Co Inc | |
| Plummer John | $310,000 | Chicago Title Insurance Co |
Source: Public Records
Mortgage History
| Date | Status | Borrower | Loan Amount |
|---|---|---|---|
| Previous Owner | Jones David S | $275,000 | |
| Previous Owner | Plummer John | $247,500 |
Source: Public Records
Tax History Compared to Growth
Tax History
| Year | Tax Paid | Tax Assessment Tax Assessment Total Assessment is a certain percentage of the fair market value that is determined by local assessors to be the total taxable value of land and additions on the property. | Land | Improvement |
|---|---|---|---|---|
| 2024 | $12,016 | $155,321 | $28,486 | $126,835 |
| 2023 | $10,743 | $137,452 | $25,209 | $112,243 |
| 2022 | $10,743 | $124,956 | $22,917 | $102,039 |
| 2021 | $10,367 | $116,782 | $21,418 | $95,364 |
| 2020 | $10,253 | $114,492 | $20,998 | $93,494 |
| 2019 | $10,154 | $111,769 | $20,998 | $90,771 |
| 2018 | $10,775 | $116,276 | $18,948 | $97,328 |
| 2017 | $10,526 | $108,669 | $17,708 | $90,961 |
| 2016 | $10,349 | $105,504 | $17,192 | $88,312 |
| 2015 | $10,629 | $103,435 | $16,855 | $86,580 |
| 2014 | -- | $100,422 | $16,364 | $84,058 |
| 2013 | -- | $100,422 | $16,364 | $84,058 |
Source: Public Records
Map
Nearby Homes
- 538 Sudbury Cir
- 315 White Pines Ln
- 406 Windsor Dr
- 483 Deerfield Dr
- 482 Deerfield Dr
- 716 Pinehurst Ln
- 714 Pinehurst Ln
- 676 Cumberland Ln
- 668 Cumberland Ln
- 609 Chestnut Dr
- 673 Cumberland Ln
- 851 Claridge Dr
- 770 Dartmouth Ln
- 777 Dartmouth Ln
- 639 Vista Dr
- 395 Danforth Dr
- 616 Briarwood Ln
- 210 Dorset Ave
- 206 E Washington St
- 94 Templeton Dr
- 309 Prairieview Dr
- 313 Prairieview Dr Unit 6
- 307 Prairieview Dr Unit 6
- 315 Prairieview Dr
- 201 Carlisle Ct
- 305 Prairieview Dr Unit 6
- 200 Carlisle Ct
- 317 Prairieview Dr
- 203 Carlisle Ct
- 314 Prairieview Dr Unit 6
- 202 Carlisle Ct Unit 6
- 303 Prairieview Dr
- 319 Prairieview Dr Unit 6
- 205 Carlisle Ct
- 316 Prairieview Dr Unit 5
- 101 Croydon Ct Unit 6
- 204 Carlisle Ct
- 301 Prairieview Dr
- 103 Croydon Ct
- 207 Carlisle Ct