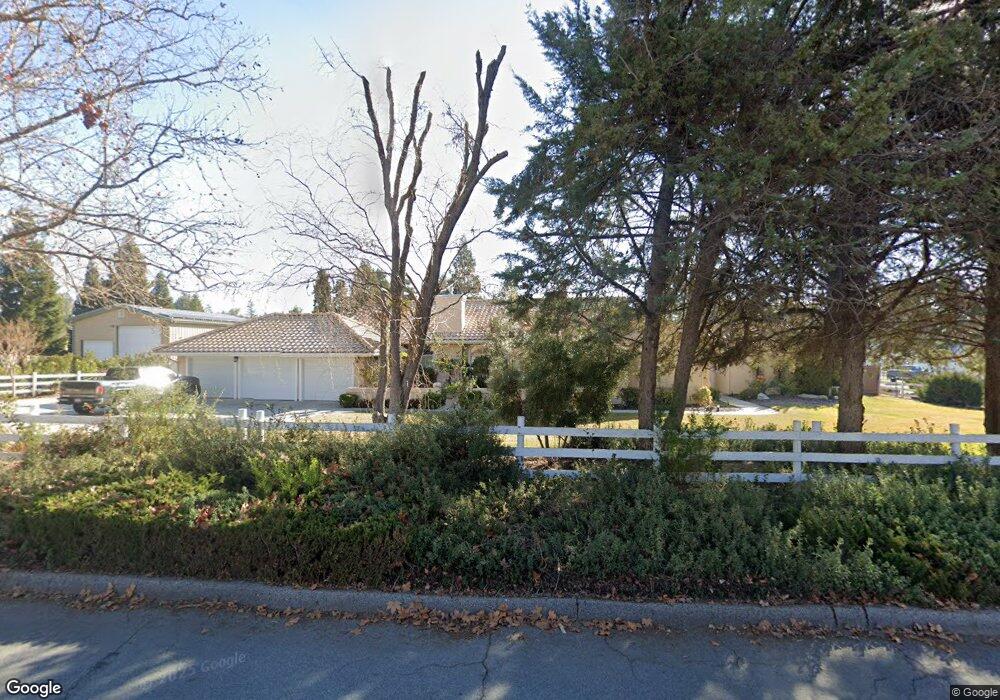
311 Puffin Way Templeton, CA 93465
Estimated Value: $1,166,000 - $1,754,000
4
Beds
3
Baths
3,407
Sq Ft
$434/Sq Ft
Est. Value
About This Home
This home is located at 311 Puffin Way, Templeton, CA 93465 and is currently estimated at $1,479,130, approximately $434 per square foot. 311 Puffin Way is a home located in San Luis Obispo County with nearby schools including Vineyard Elementary School, Templeton Elementary School, and Templeton Middle School.
Ownership History
Date
Name
Owned For
Owner Type
Purchase Details
Closed on
Jan 25, 2011
Sold by
Chalker Ronald and Chalker Waynell Joy
Bought by
Chalker Ronald and Chalker Waynell Joy
Current Estimated Value
Purchase Details
Closed on
Apr 10, 2001
Sold by
Chalker Ronald and Chalker Joy
Bought by
Chalker Ronald and Chalker Waynell J
Home Financials for this Owner
Home Financials are based on the most recent Mortgage that was taken out on this home.
Original Mortgage
$1,160,000
Outstanding Balance
$429,849
Interest Rate
7.09%
Estimated Equity
$1,049,281
Purchase Details
Closed on
Feb 25, 1994
Sold by
Heely Robert and Heely Jill
Bought by
Chalker Ronald and Chalker Joy
Home Financials for this Owner
Home Financials are based on the most recent Mortgage that was taken out on this home.
Original Mortgage
$245,600
Interest Rate
7.15%
Create a Home Valuation Report for This Property
The Home Valuation Report is an in-depth analysis detailing your home's value as well as a comparison with similar homes in the area
Home Values in the Area
Average Home Value in this Area
Purchase History
| Date | Buyer | Sale Price | Title Company |
|---|---|---|---|
| Chalker Ronald | -- | None Available | |
| Chalker Ronald L | -- | None Available | |
| Chalker Ronald | -- | Chicago Title Co | |
| Chalker Ronald | $307,000 | Cuesta Title Guaranty Compan |
Source: Public Records
Mortgage History
| Date | Status | Borrower | Loan Amount |
|---|---|---|---|
| Open | Chalker Ronald | $1,160,000 | |
| Closed | Chalker Ronald | $245,600 |
Source: Public Records
Tax History
| Year | Tax Paid | Tax Assessment Tax Assessment Total Assessment is a certain percentage of the fair market value that is determined by local assessors to be the total taxable value of land and additions on the property. | Land | Improvement |
|---|---|---|---|---|
| 2025 | $7,241 | $673,007 | $242,132 | $430,875 |
| 2024 | $7,109 | $659,812 | $237,385 | $422,427 |
| 2023 | $7,109 | $646,876 | $232,731 | $414,145 |
| 2022 | $6,971 | $634,193 | $228,168 | $406,025 |
| 2021 | $6,832 | $621,759 | $223,695 | $398,064 |
| 2020 | $6,760 | $615,385 | $221,402 | $393,983 |
| 2019 | $6,448 | $603,319 | $217,061 | $386,258 |
| 2018 | $6,320 | $591,490 | $212,805 | $378,685 |
| 2017 | $6,194 | $579,893 | $208,633 | $371,260 |
| 2016 | $6,071 | $568,524 | $204,543 | $363,981 |
| 2015 | $5,978 | $559,985 | $201,471 | $358,514 |
| 2014 | $5,756 | $549,017 | $197,525 | $351,492 |
Source: Public Records
Map
Nearby Homes
- 1609 Tanager Ct
- 1 Las Tablas Rd
- 1095 Megan Ct
- 325 Conover Ln
- 117 Frontier Way
- 732 Lavender Ln
- 810 Forest Ave
- 720 Gough Ave
- 0 Old Creek Rd
- 1225 Santa Rita Rd
- 323 Crum Rd
- 618 Forest Ave
- 1235 Shane Ln
- 1220 Bennett Way Unit 1
- 2455 Ca-46
- 110 8th St
- 153 Horstman St
- 2925 Oakdale Rd
- 8 Championship Ln
- 115 2nd St
- 351 Puffin Way
- 347 Puffin Way
- 1613 Tanager Ct
- 353 Puffin Way
- 308 Puffin Way
- 366 Puffin Way
- 272 Puffin Way
- 1571 Tanager Ct
- 1680 Ironwood Place
- 1735 Las Tablas Rd
- 256 Puffin Way
- 1690 Ironwood Place
- 1610 Tanager Ct
- 1582 Tanager Ct
- 222 Puffin Way
- 1541 Tanager Ct
- 1710 Ironwood Place
- 1720 Ironwood Place
- 192 Helgren Ct
- 420 Burlwood Ln
Your Personal Tour Guide
Ask me questions while you tour the home.