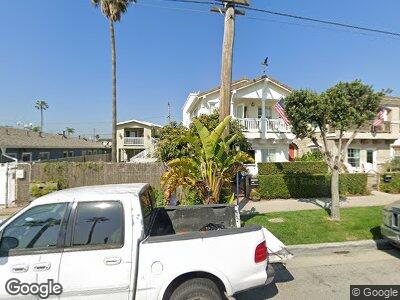
311 Seal Beach Blvd Seal Beach, CA 90740
Estimated Value: $2,512,665 - $3,000,000
3
Beds
3
Baths
2,680
Sq Ft
$1,035/Sq Ft
Est. Value
About This Home
This home is located at 311 Seal Beach Blvd, Seal Beach, CA 90740 and is currently estimated at $2,773,916, approximately $1,035 per square foot. 311 Seal Beach Blvd is a home located in Orange County with nearby schools including J. H. Mcgaugh Elementary School, Jack L. Weaver Elementary School, and Sharon Christa Mcauliffe Middle School.
Ownership History
Date
Name
Owned For
Owner Type
Purchase Details
Closed on
Jan 6, 2015
Sold by
Richardson Thomas C and Richardson Sharon Bourne
Bought by
Wolfe Larry J and Wolfe Linda S Chapman
Current Estimated Value
Purchase Details
Closed on
Mar 26, 2002
Sold by
Beachwalk 7 Llc
Bought by
Richardson Thomas C and Richardson Sharon Bourne
Home Financials for this Owner
Home Financials are based on the most recent Mortgage that was taken out on this home.
Original Mortgage
$37,450
Interest Rate
7.13%
Mortgage Type
Credit Line Revolving
Create a Home Valuation Report for This Property
The Home Valuation Report is an in-depth analysis detailing your home's value as well as a comparison with similar homes in the area
Home Values in the Area
Average Home Value in this Area
Purchase History
| Date | Buyer | Sale Price | Title Company |
|---|---|---|---|
| Wolfe Larry J | $1,439,000 | North American Title Co | |
| Richardson Thomas C | $750,000 | First American Title Co |
Source: Public Records
Mortgage History
| Date | Status | Borrower | Loan Amount |
|---|---|---|---|
| Previous Owner | Richardson Thomas C | $200,000 | |
| Previous Owner | Richardson Thomas C | $200,000 | |
| Previous Owner | Richardson Thomas C | $250,000 | |
| Previous Owner | Richardson Thomas C | $250,000 | |
| Previous Owner | Richardson Thomas C | $114,000 | |
| Previous Owner | Richardson Thomas C | $806,250 | |
| Previous Owner | Richardson Thomas C | $636,400 | |
| Previous Owner | Richardson Thomas C | $638,650 | |
| Previous Owner | Richardson Thomas C | $37,450 | |
| Previous Owner | Richardson Thomas C | $599,900 |
Source: Public Records
Tax History Compared to Growth
Tax History
| Year | Tax Paid | Tax Assessment Tax Assessment Total Assessment is a certain percentage of the fair market value that is determined by local assessors to be the total taxable value of land and additions on the property. | Land | Improvement |
|---|---|---|---|---|
| 2024 | $19,413 | $1,695,549 | $1,307,673 | $387,876 |
| 2023 | $18,988 | $1,662,303 | $1,282,032 | $380,271 |
| 2022 | $18,805 | $1,629,709 | $1,256,894 | $372,815 |
| 2021 | $18,388 | $1,597,754 | $1,232,249 | $365,505 |
| 2020 | $18,428 | $1,581,371 | $1,219,613 | $361,758 |
| 2019 | $17,855 | $1,550,364 | $1,195,699 | $354,665 |
| 2018 | $17,029 | $1,519,965 | $1,172,254 | $347,711 |
| 2017 | $16,672 | $1,490,162 | $1,149,268 | $340,894 |
| 2016 | $16,358 | $1,460,944 | $1,126,734 | $334,210 |
| 2015 | $10,464 | $921,768 | $581,065 | $340,703 |
| 2014 | $10,210 | $903,712 | $569,682 | $334,030 |
Source: Public Records
Map
Nearby Homes
- 311 Seal Beach Blvd
- 313 Seal Beach Blvd
- 309 Seal Beach Blvd
- 315 Seal Beach Blvd
- 307 Seal Beach Blvd
- 317 Seal Beach Blvd
- 303 Seal Beach Blvd
- 319 Seal Beach Blvd
- 312 17th St
- 314 17th St
- 308 17th St
- 318 17th St
- 321 Seal Beach Blvd
- 306 17th St
- 320 17th St
- 1702 Landing Ave
- 323 Seal Beach Blvd
- 322 17th St Unit B
- 322 17th St
- 324 17th St