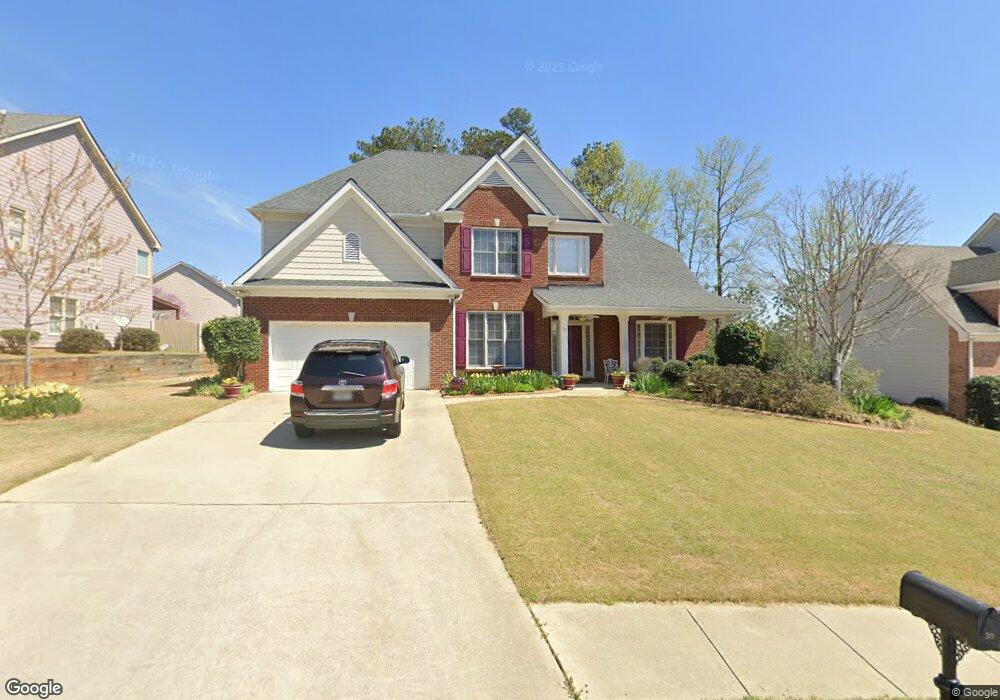
311 Viceroy Curve Stockbridge, GA 30281
Estimated Value: $346,000 - $359,000
4
Beds
3
Baths
2,389
Sq Ft
$147/Sq Ft
Est. Value
About This Home
This home is located at 311 Viceroy Curve, Stockbridge, GA 30281 and is currently estimated at $350,994, approximately $146 per square foot. 311 Viceroy Curve is a home located in Henry County with nearby schools including Red Oak Elementary School, Dutchtown Middle School, and Dutchtown High School.
Ownership History
Date
Name
Owned For
Owner Type
Purchase Details
Closed on
May 31, 2006
Sold by
Pacheco Francisco J and Pacheco Virginia
Bought by
Jackson Oswin S and Jackson Theresa L
Current Estimated Value
Home Financials for this Owner
Home Financials are based on the most recent Mortgage that was taken out on this home.
Original Mortgage
$140,900
Outstanding Balance
$82,394
Interest Rate
6.57%
Mortgage Type
New Conventional
Estimated Equity
$268,600
Purchase Details
Closed on
Aug 22, 2001
Sold by
Morrison Homes Inc
Bought by
Pacheo Francisco J and Pacheo Virginia
Home Financials for this Owner
Home Financials are based on the most recent Mortgage that was taken out on this home.
Original Mortgage
$161,200
Interest Rate
6.25%
Mortgage Type
New Conventional
Create a Home Valuation Report for This Property
The Home Valuation Report is an in-depth analysis detailing your home's value as well as a comparison with similar homes in the area
Home Values in the Area
Average Home Value in this Area
Purchase History
| Date | Buyer | Sale Price | Title Company |
|---|---|---|---|
| Jackson Oswin S | $214,900 | -- | |
| Pacheo Francisco J | $201,500 | -- |
Source: Public Records
Mortgage History
| Date | Status | Borrower | Loan Amount |
|---|---|---|---|
| Open | Jackson Oswin S | $140,900 | |
| Previous Owner | Pacheo Francisco J | $161,200 |
Source: Public Records
Tax History Compared to Growth
Tax History
| Year | Tax Paid | Tax Assessment Tax Assessment Total Assessment is a certain percentage of the fair market value that is determined by local assessors to be the total taxable value of land and additions on the property. | Land | Improvement |
|---|---|---|---|---|
| 2025 | $1,635 | $130,480 | $18,000 | $112,480 |
| 2024 | $1,635 | $129,360 | $18,000 | $111,360 |
| 2023 | $1,456 | $135,920 | $14,000 | $121,920 |
| 2022 | $1,240 | $118,200 | $14,000 | $104,200 |
| 2021 | $1,239 | $92,160 | $12,000 | $80,160 |
| 2020 | $1,239 | $83,800 | $10,000 | $73,800 |
| 2019 | $1,096 | $77,240 | $10,000 | $67,240 |
| 2018 | $1,094 | $77,080 | $10,000 | $67,080 |
| 2016 | $895 | $63,600 | $9,600 | $54,000 |
| 2015 | $904 | $60,680 | $7,200 | $53,480 |
| 2014 | $806 | $53,440 | $7,200 | $46,240 |
Source: Public Records
Map
Nearby Homes
- 687 Pathwood Ln
- 266 Monarch Village Way
- 591 Creek Valley Ct
- 520 Monarch Lake Way
- 3916 Champagne Dr
- 602 Brookwater Dr
- 623 Brookwater Dr
- 300 Monarch Village Way
- 540 Anglewood Trace
- 719 Nightwind Way
- 512 Chaucer Way Unit 1
- 213 Sunderland Way Unit 1
- 4025 Jamaica Dr
- 9055 Kelly Ct
- 1341 Kent Manor Unit 3
- 1653 Jersey Dr
- 125 Oak Leaf Dr
- 117 Titan Rd
- 1545 Brangus Dr
- 313 Viceroy Curve
- 550 Creek Valley Ct
- 0 Viceroy Curve Unit 8437209
- 0 Viceroy Curve Unit 7612861
- 552 Creek Valley Ct
- 315 Viceroy Curve
- 414 Azure Ct
- 412 Azure Ct
- 312 Viceroy Curve
- 554 Creek Valley Ct
- 310 Viceroy Curve
- 314 Viceroy Curve
- 551 Creek Valley Ct
- 317 Viceroy Curve
- 308 Viceroy Curve
- 410 Azure Ct
- 415 Azure Ct
- 316 Viceroy Curve
- 556 Creek Valley Ct
- 553 Creek Valley Ct