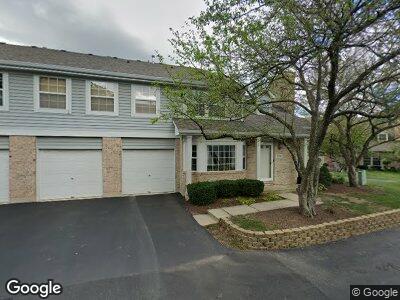
3110 Anton Cir Aurora, IL 60504
Waubonsie NeighborhoodEstimated Value: $299,000 - $329,000
2
Beds
3
Baths
1,700
Sq Ft
$182/Sq Ft
Est. Value
About This Home
This home is located at 3110 Anton Cir, Aurora, IL 60504 and is currently estimated at $308,884, approximately $181 per square foot. 3110 Anton Cir is a home located in DuPage County with nearby schools including McCarty Elementary School, Fischer Middle School, and Waubonsie Valley High School.
Ownership History
Date
Name
Owned For
Owner Type
Purchase Details
Closed on
Jul 2, 2024
Sold by
Paulson Patrick T and Paulson Linda K
Bought by
Petri Jeremy J
Current Estimated Value
Purchase Details
Closed on
Sep 18, 2018
Sold by
Paulson Patrick T and Paulson Linda K
Bought by
Paulson Patrick T and Paulson Linda K
Purchase Details
Closed on
Jul 14, 2000
Sold by
Lewis Guy and Salman Christopher
Bought by
Paulson Patrick T and Paulson Linda K
Home Financials for this Owner
Home Financials are based on the most recent Mortgage that was taken out on this home.
Original Mortgage
$116,000
Interest Rate
8.31%
Purchase Details
Closed on
Jul 1, 1999
Sold by
Knox Trent H and Knox Diana K
Bought by
Lewis Guy and Salman Christopher
Home Financials for this Owner
Home Financials are based on the most recent Mortgage that was taken out on this home.
Original Mortgage
$103,050
Interest Rate
7.54%
Create a Home Valuation Report for This Property
The Home Valuation Report is an in-depth analysis detailing your home's value as well as a comparison with similar homes in the area
Home Values in the Area
Average Home Value in this Area
Purchase History
| Date | Buyer | Sale Price | Title Company |
|---|---|---|---|
| Petri Jeremy J | -- | None Listed On Document | |
| Petri Jeremy J | -- | None Listed On Document | |
| Paulson Patrick T | -- | Attorney | |
| Paulson Patrick T | $145,000 | Law Title Pick Up | |
| Lewis Guy | $108,500 | -- |
Source: Public Records
Mortgage History
| Date | Status | Borrower | Loan Amount |
|---|---|---|---|
| Previous Owner | Paulson Patrick T | $115,000 | |
| Previous Owner | Paulson Patrick T | $116,000 | |
| Previous Owner | Tennis Sandra M | $80,000 | |
| Previous Owner | Paulson Patrick T | $116,000 | |
| Previous Owner | Lewis Guy | $103,050 |
Source: Public Records
Tax History Compared to Growth
Tax History
| Year | Tax Paid | Tax Assessment Tax Assessment Total Assessment is a certain percentage of the fair market value that is determined by local assessors to be the total taxable value of land and additions on the property. | Land | Improvement |
|---|---|---|---|---|
| 2023 | $5,965 | $73,400 | $17,330 | $56,070 |
| 2022 | $5,633 | $67,170 | $15,730 | $51,440 |
| 2021 | $5,495 | $64,770 | $15,170 | $49,600 |
| 2020 | $5,562 | $64,770 | $15,170 | $49,600 |
| 2019 | $5,381 | $61,600 | $14,430 | $47,170 |
| 2018 | $4,878 | $55,230 | $13,140 | $42,090 |
| 2017 | $4,807 | $53,350 | $12,690 | $40,660 |
| 2016 | $4,734 | $51,200 | $12,180 | $39,020 |
| 2015 | $4,702 | $48,610 | $11,560 | $37,050 |
| 2014 | $4,597 | $46,140 | $10,790 | $35,350 |
| 2013 | $4,547 | $46,460 | $10,860 | $35,600 |
Source: Public Records
Map
Nearby Homes
- 3094 Anton Cir
- 3051 Anton Dr Unit 34
- 3070 Anton Cir
- 2974 Waters Edge Cir Unit 42974
- 3252 Anton Dr Unit 126
- 50 Ascot Ln
- 122 Creston Cir Unit 156C
- 85 Braxton Ln Unit 91W
- 3166 Village Green Dr
- 360 Cimarron Ct
- 3127 Eugene Ln
- 2735 Carriage Way Unit 37
- 2641 Asbury Dr
- 2575 Adamsway Dr
- 496 Belvedere Ln
- 3407 Sandpiper Dr
- 227 Vaughn Rd
- 148 Park Ridge Ct
- 2551 Doncaster Dr
- 430 Cimarron Dr W
- 3110 Anton Cir
- 3116 Anton Cir
- 3116 Anton Cir Unit 3116
- 3112 Anton Cir
- 3114 Anton Cir
- 3104 Anton Cir
- 3106 Anton Cir
- 3132 Anton Cir Unit 34
- 3102 Anton Cir
- 3134 Anton Cir Unit 34
- 3100 Anton Cir
- 3140 Anton Cir
- 3130 Anton Dr
- 3142 Anton Cir
- 3142 Anton Cir Unit 3142
- 3136 Anton Dr
- 3122 Anton Cir
- 3124 Anton Dr
- 3146 Anton Dr
- 3126 Anton Cir