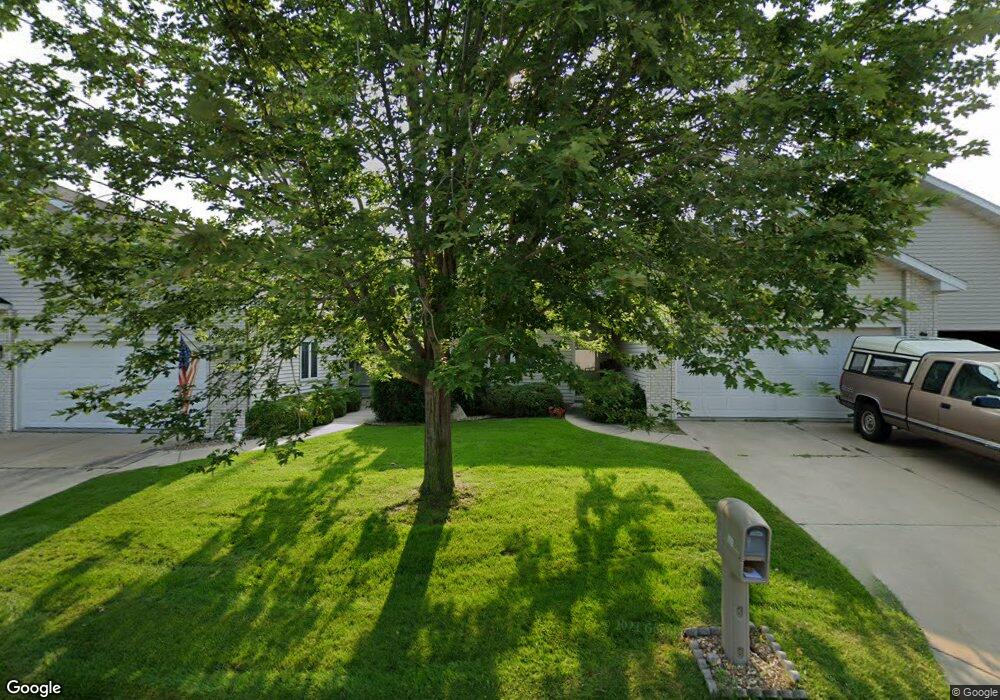
3113 Yorkshire Dr NE Unit 3113 Cedar Rapids, IA 52402
Estimated Value: $174,000 - $219,000
2
Beds
2
Baths
1,429
Sq Ft
$140/Sq Ft
Est. Value
About This Home
This home is located at 3113 Yorkshire Dr NE Unit 3113, Cedar Rapids, IA 52402 and is currently estimated at $199,362, approximately $139 per square foot. 3113 Yorkshire Dr NE Unit 3113 is a home located in Linn County with nearby schools including Arthur Elementary School, Franklin Middle School, and George Washington High School.
Ownership History
Date
Name
Owned For
Owner Type
Purchase Details
Closed on
Sep 3, 2010
Sold by
Gardner Dale E and Gardner Janet L
Bought by
Crosser Billie D and Crosser Barbara J
Current Estimated Value
Purchase Details
Closed on
Feb 1, 2007
Sold by
Wertz Pamela D Boley and Estelle E Boley Inter Vivos Re
Bought by
Gardner Dale E and Gardner Janet L
Purchase Details
Closed on
May 10, 2002
Sold by
Vanhorn Robert G
Bought by
Boley Estelle E
Home Financials for this Owner
Home Financials are based on the most recent Mortgage that was taken out on this home.
Original Mortgage
$100,000
Interest Rate
4.12%
Purchase Details
Closed on
Nov 25, 1998
Sold by
Klenske Daniel R
Bought by
Vanhorn Robert G
Home Financials for this Owner
Home Financials are based on the most recent Mortgage that was taken out on this home.
Original Mortgage
$114,400
Interest Rate
6.96%
Create a Home Valuation Report for This Property
The Home Valuation Report is an in-depth analysis detailing your home's value as well as a comparison with similar homes in the area
Home Values in the Area
Average Home Value in this Area
Purchase History
| Date | Buyer | Sale Price | Title Company |
|---|---|---|---|
| Crosser Billie D | $175,500 | None Available | |
| Gardner Dale E | $162,000 | None Available | |
| Boley Estelle E | $159,500 | -- | |
| Vanhorn Robert G | $142,500 | -- |
Source: Public Records
Mortgage History
| Date | Status | Borrower | Loan Amount |
|---|---|---|---|
| Previous Owner | Boley Estelle E | $100,000 | |
| Previous Owner | Vanhorn Robert G | $114,400 |
Source: Public Records
Tax History Compared to Growth
Tax History
| Year | Tax Paid | Tax Assessment Tax Assessment Total Assessment is a certain percentage of the fair market value that is determined by local assessors to be the total taxable value of land and additions on the property. | Land | Improvement |
|---|---|---|---|---|
| 2025 | $2,846 | $195,100 | $34,500 | $160,600 |
| 2024 | $3,456 | $187,300 | $28,000 | $159,300 |
| 2023 | $3,456 | $178,300 | $28,000 | $150,300 |
| 2022 | $3,392 | $172,700 | $28,000 | $144,700 |
| 2021 | $3,656 | $172,700 | $28,000 | $144,700 |
| 2020 | $3,656 | $174,300 | $28,000 | $146,300 |
| 2019 | $3,156 | $154,900 | $28,000 | $126,900 |
| 2018 | $2,828 | $154,900 | $28,000 | $126,900 |
| 2017 | $3,103 | $152,100 | $13,000 | $139,100 |
| 2016 | $3,103 | $146,000 | $13,000 | $133,000 |
| 2015 | $3,439 | $161,628 | $13,000 | $148,628 |
| 2014 | $3,254 | $161,628 | $13,000 | $148,628 |
| 2013 | $3,180 | $161,628 | $13,000 | $148,628 |
Source: Public Records
Map
Nearby Homes
- 3117 Yorkshire Dr NE Unit 3117
- 3109 Yorkshire Dr NE
- 3105 Yorkshire Dr NE
- 3025 Yorkshire Dr NE
- 3127 Yorkshire Dr NE Unit 3127
- 3123 Yorkshire Dr NE
- 3106 Yorkshire Dr NE
- 3100 Yorkshire Dr NE
- 3024 Yorkshire Dr NE
- 3020 Yorkshire Dr NE
- 610 31st St NE
- 3112 E Ave NE
- 3116 E Ave NE
- 639 Crystal Dr NE
- 637 Crystal Dr NE Unit 637
- 633 Crystal Dr NE
- 3106 E Ave NE
- 3015 Yorkshire Dr NE
- 3011 Yorkshire Dr NE
- 3100 E Ave NE