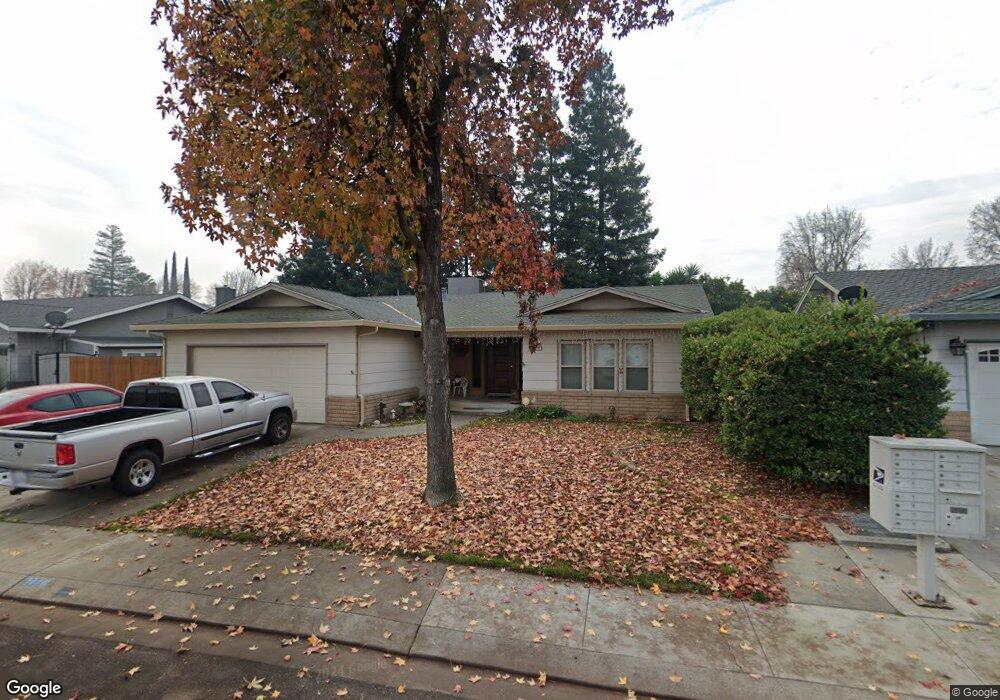
3116 Hummingbird Ct Modesto, CA 95356
Estimated Value: $245,000 - $462,000
3
Beds
2
Baths
1,400
Sq Ft
$285/Sq Ft
Est. Value
About This Home
This home is located at 3116 Hummingbird Ct, Modesto, CA 95356 and is currently estimated at $398,847, approximately $284 per square foot. 3116 Hummingbird Ct is a home located in Stanislaus County with nearby schools including Salida Elementary School, Salida Middle School - Vella Campus, and Joseph A. Gregori High School.
Ownership History
Date
Name
Owned For
Owner Type
Purchase Details
Closed on
Nov 15, 2010
Sold by
Castro Richard J and Castro Andrea E
Bought by
Castro Richard and Castro Andrea
Current Estimated Value
Purchase Details
Closed on
May 21, 1998
Sold by
Castro Richard J and Castro Andrea E
Bought by
Castro Richard J and Castro Andrea E
Home Financials for this Owner
Home Financials are based on the most recent Mortgage that was taken out on this home.
Original Mortgage
$108,000
Outstanding Balance
$21,047
Interest Rate
7.07%
Mortgage Type
VA
Estimated Equity
$377,800
Purchase Details
Closed on
May 18, 1998
Sold by
Jensen Gordon V and Jensen Peter
Bought by
Castro Richard J and Castro Andrea E
Home Financials for this Owner
Home Financials are based on the most recent Mortgage that was taken out on this home.
Original Mortgage
$108,000
Outstanding Balance
$21,047
Interest Rate
7.07%
Mortgage Type
VA
Estimated Equity
$377,800
Create a Home Valuation Report for This Property
The Home Valuation Report is an in-depth analysis detailing your home's value as well as a comparison with similar homes in the area
Home Values in the Area
Average Home Value in this Area
Purchase History
| Date | Buyer | Sale Price | Title Company |
|---|---|---|---|
| Castro Richard | -- | None Available | |
| Castro Richard J | -- | Stewart Title | |
| Castro Richard J | -- | Stewart Title |
Source: Public Records
Mortgage History
| Date | Status | Borrower | Loan Amount |
|---|---|---|---|
| Open | Castro Richard J | $108,000 |
Source: Public Records
Tax History Compared to Growth
Tax History
| Year | Tax Paid | Tax Assessment Tax Assessment Total Assessment is a certain percentage of the fair market value that is determined by local assessors to be the total taxable value of land and additions on the property. | Land | Improvement |
|---|---|---|---|---|
| 2025 | -- | $172,428 | $51,084 | $121,344 |
| 2024 | -- | $169,048 | $50,083 | $118,965 |
| 2023 | $52 | $165,734 | $49,101 | $116,633 |
| 2022 | $1,687 | $162,486 | $48,139 | $114,347 |
| 2021 | $1,663 | $159,301 | $47,196 | $112,105 |
| 2020 | $1,598 | $157,669 | $46,713 | $110,956 |
| 2019 | $1,579 | $154,579 | $45,798 | $108,781 |
| 2018 | $1,544 | $151,549 | $44,900 | $106,649 |
| 2017 | $1,507 | $148,578 | $44,020 | $104,558 |
| 2016 | $1,476 | $145,665 | $43,157 | $102,508 |
| 2015 | $1,456 | $143,478 | $42,509 | $100,969 |
| 2014 | $1,427 | $140,669 | $41,677 | $98,992 |
Source: Public Records
Map
Nearby Homes
- 3132 Golden Eagle Ln
- 3933 Dale Rd Unit B
- 3628 Landmark Cir
- 3937 Dale Rd Unit A
- 3221 Showcase Way
- 4005 Honey Creek Rd
- 3104 Landmark Cir
- 4045 Dale Rd Unit C
- 4005 Dale Rd Unit D
- 3264 Showcase Way
- 1540 Aspire Way
- 1517 Luminous St
- 4368 Icon Ave
- 1500 Aspire Way
- 3733 Beachler Dr
- 4061 Dale Rd Unit C
- 4001 Wheeler Peak Way
- 3400 Sullivan Ct Unit 105
- 3400 Sullivan Ct Unit 201
- 3424 Vintage Dr Unit 152
- 3120 Hummingbird Ct
- 3112 Hummingbird Ct
- 3121 Nightingale Dr
- 3117 Nightingale Dr
- 3125 Nightingale Dr
- 3124 Hummingbird Ct
- 3113 Nightingale Dr
- 3117 Hummingbird Ct
- 3129 Nightingale Dr
- 3113 Hummingbird Ct
- 3108 Hummingbird Ct
- 3109 Nightingale Dr
- 3109 Hummingbird Ct
- 3105 Hummingbird Ct
- 3832 Honey Creek Rd
- 3120 Nightingale Dr
- 3105 Nightingale Dr
- 3808 Nightingale Ct
- 3808 Honey Creek Rd