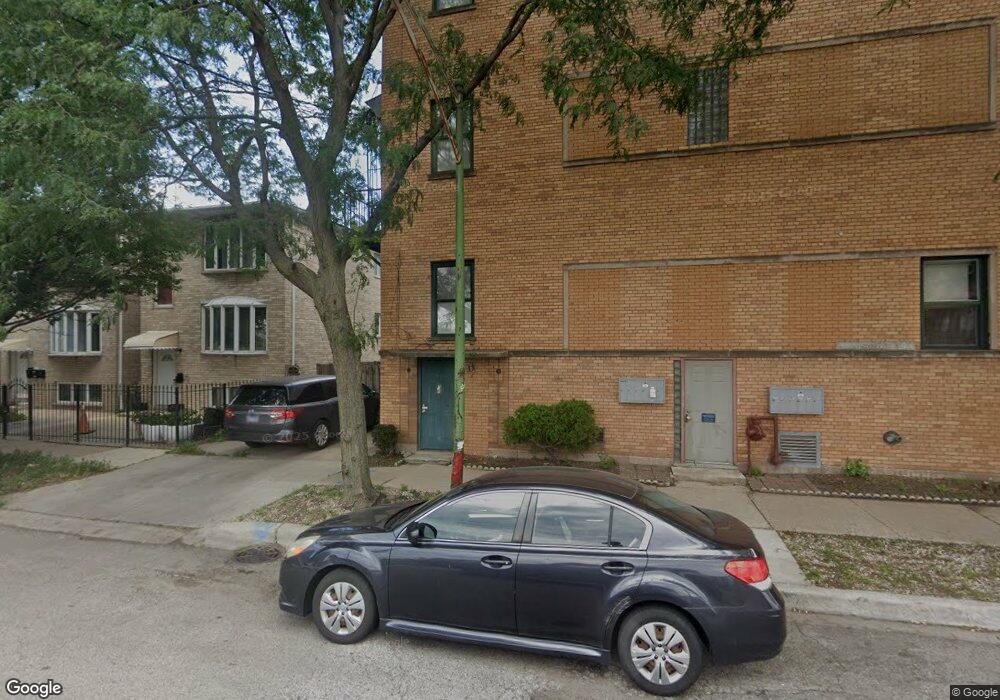
3117 S Benson St Unit 17 Chicago, IL 60608
Bridgeport NeighborhoodEstimated Value: $300,000 - $450,000
--
Bed
--
Bath
--
Sq Ft
0.28
Acres
About This Home
This home is located at 3117 S Benson St Unit 17, Chicago, IL 60608 and is currently estimated at $388,460. 3117 S Benson St Unit 17 is a home located in Cook County with nearby schools including Holden Elementary School, St Therese School West, and St Barbara Elementary School.
Ownership History
Date
Name
Owned For
Owner Type
Purchase Details
Closed on
Jul 26, 2017
Sold by
Schwider Thomas F and Londay Susan L
Bought by
Huang Dexuan and Huang Selina Wenhua
Current Estimated Value
Home Financials for this Owner
Home Financials are based on the most recent Mortgage that was taken out on this home.
Original Mortgage
$160,000
Outstanding Balance
$85,394
Interest Rate
3.9%
Mortgage Type
New Conventional
Estimated Equity
$303,066
Purchase Details
Closed on
Nov 20, 2009
Sold by
Schwider Thomas F and Londay Susan L
Bought by
Schwider Thomas F and Londay Susan L
Purchase Details
Closed on
Jul 23, 2003
Sold by
Austin Bank Of Chicago
Bought by
Schwider Thomas F and Londay Susan L
Home Financials for this Owner
Home Financials are based on the most recent Mortgage that was taken out on this home.
Original Mortgage
$172,000
Interest Rate
5.3%
Mortgage Type
Unknown
Create a Home Valuation Report for This Property
The Home Valuation Report is an in-depth analysis detailing your home's value as well as a comparison with similar homes in the area
Home Values in the Area
Average Home Value in this Area
Purchase History
| Date | Buyer | Sale Price | Title Company |
|---|---|---|---|
| Huang Dexuan | $290,000 | Precision Title | |
| Schwider Thomas F | -- | Multiple | |
| Schwider Thomas F | $215,000 | Cti |
Source: Public Records
Mortgage History
| Date | Status | Borrower | Loan Amount |
|---|---|---|---|
| Open | Huang Dexuan | $160,000 | |
| Previous Owner | Schwider Thomas F | $172,000 |
Source: Public Records
Tax History Compared to Growth
Tax History
| Year | Tax Paid | Tax Assessment Tax Assessment Total Assessment is a certain percentage of the fair market value that is determined by local assessors to be the total taxable value of land and additions on the property. | Land | Improvement |
|---|---|---|---|---|
| 2024 | $3,520 | $36,943 | $5,071 | $31,872 |
| 2023 | $3,410 | $20,000 | $4,098 | $15,902 |
| 2022 | $3,410 | $20,000 | $4,098 | $15,902 |
| 2021 | $3,352 | $19,998 | $4,097 | $15,901 |
| 2020 | $3,887 | $20,551 | $3,278 | $17,273 |
| 2019 | $3,919 | $22,937 | $3,278 | $19,659 |
| 2018 | $4,531 | $22,937 | $3,278 | $19,659 |
| 2017 | $3,243 | $18,441 | $2,561 | $15,880 |
| 2016 | $3,193 | $18,441 | $2,561 | $15,880 |
| 2015 | $2,899 | $18,441 | $2,561 | $15,880 |
| 2014 | $2,687 | $17,050 | $2,177 | $14,873 |
| 2013 | $2,623 | $17,050 | $2,177 | $14,873 |
Source: Public Records
Map
Nearby Homes
- 1312 W 31st St
- 1226 W 31st Place
- 3456 S Archer Ave
- 1220 W 32nd Place
- 2833 S Broad St
- 4936 S Loomis St
- 3217 S May St
- 3331 S Ashland Ave
- 2903 S Hillock Ave
- 3212 S Aberdeen St
- 2859 S Hillock Ave
- 3188 S Archer Ave Unit 301
- 3188 S Archer Ave Unit 202
- 3228 S Paulina St
- 2948 S Lyman St
- 2922 S Keeley St
- 1012 W 32nd Place
- 2951 S Farrell St
- 2947 S Farrell St
- 3340 S Carpenter St
- 3117 S Benson St Unit P5
- 3117 S Benson St Unit P3
- 3117 S Benson St
- 3119 S Benson St Unit P4
- 3119 S Benson St Unit 19
- 3119 S Benson St Unit 1004
- 3119 S Benson St Unit 1
- 3119 S Benson St
- 3123 S Benson St Unit 23
- 3123 S Benson St Unit P6
- 3115 S Benson St Unit P2
- 3113 S Benson St Unit P1
- 3121 S Benson St Unit 21
- 3113 S Benson St Unit 13
- 3115 S Benson St Unit 15
- 3113 S Benson St
- 3125 S Benson St Unit P7
- 3125 S Benson St Unit 25
- 3109 S Benson St
- 3105 S Benson St