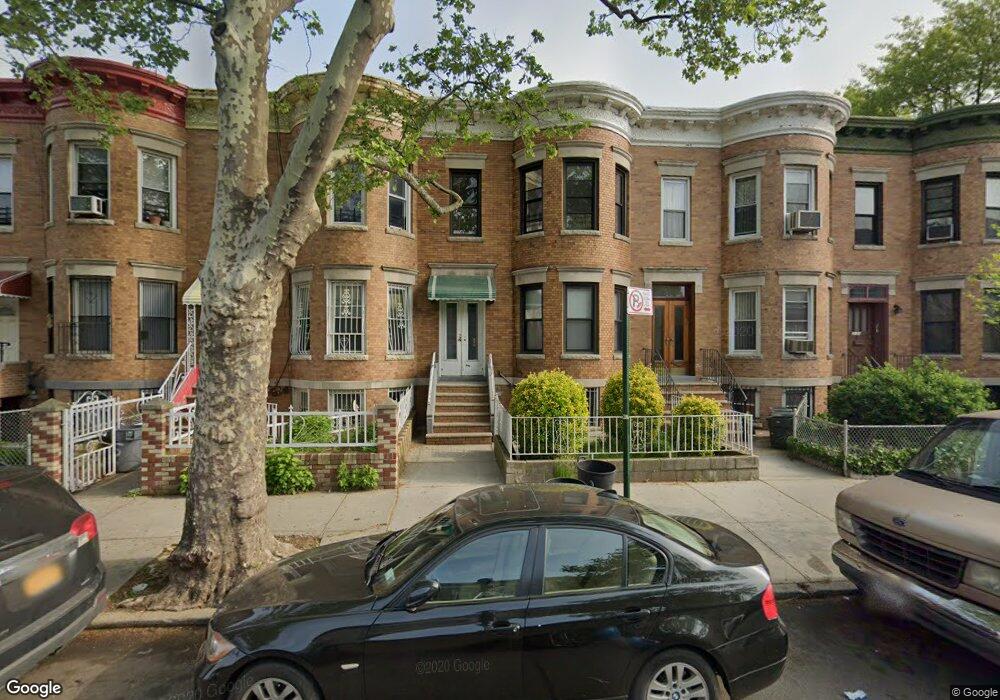
3117 Snyder Ave Brooklyn, NY 11226
Flatbush NeighborhoodEstimated Value: $1,150,000 - $1,287,266
--
Bed
--
Bath
2,048
Sq Ft
$601/Sq Ft
Est. Value
About This Home
This home is located at 3117 Snyder Ave, Brooklyn, NY 11226 and is currently estimated at $1,231,317, approximately $601 per square foot. 3117 Snyder Ave is a home located in Kings County with nearby schools including P.S. 181, Middle School 246 Walt Whitman, and Flatbush Ascend Charter School.
Ownership History
Date
Name
Owned For
Owner Type
Purchase Details
Closed on
Aug 1, 2022
Sold by
Coronato Thomas and Garcia-Fresco Clarisa
Bought by
Canney Alexis and Canney Tara Laudi
Current Estimated Value
Home Financials for this Owner
Home Financials are based on the most recent Mortgage that was taken out on this home.
Original Mortgage
$529,000
Outstanding Balance
$506,504
Interest Rate
5.7%
Mortgage Type
Purchase Money Mortgage
Estimated Equity
$724,813
Purchase Details
Closed on
Jun 20, 2016
Sold by
Mclean Melvin
Bought by
Coronato Thomas and Garcia-Fresco Clarisa
Home Financials for this Owner
Home Financials are based on the most recent Mortgage that was taken out on this home.
Original Mortgage
$521,977
Interest Rate
3.75%
Mortgage Type
FHA
Purchase Details
Closed on
Aug 10, 2004
Sold by
Estate Of Viola Annette Dyke By
Bought by
Mclean Evelyn and Mclean Melvin
Home Financials for this Owner
Home Financials are based on the most recent Mortgage that was taken out on this home.
Original Mortgage
$292,000
Interest Rate
6.08%
Mortgage Type
Purchase Money Mortgage
Create a Home Valuation Report for This Property
The Home Valuation Report is an in-depth analysis detailing your home's value as well as a comparison with similar homes in the area
Home Values in the Area
Average Home Value in this Area
Purchase History
| Date | Buyer | Sale Price | Title Company |
|---|---|---|---|
| Canney Alexis | $1,179,000 | -- | |
| Coronato Thomas | $570,000 | -- | |
| Mclean Evelyn | $365,000 | -- |
Source: Public Records
Mortgage History
| Date | Status | Borrower | Loan Amount |
|---|---|---|---|
| Open | Canney Alexis | $529,000 | |
| Previous Owner | Coronato Thomas | $521,977 | |
| Previous Owner | Mclean Evelyn | $292,000 |
Source: Public Records
Tax History Compared to Growth
Tax History
| Year | Tax Paid | Tax Assessment Tax Assessment Total Assessment is a certain percentage of the fair market value that is determined by local assessors to be the total taxable value of land and additions on the property. | Land | Improvement |
|---|---|---|---|---|
| 2025 | $7,028 | $57,300 | $20,040 | $37,260 |
| 2024 | $7,028 | $54,060 | $20,040 | $34,020 |
| 2023 | $6,916 | $49,740 | $20,040 | $29,700 |
| 2022 | $6,831 | $46,020 | $20,040 | $25,980 |
| 2021 | $6,793 | $47,940 | $20,040 | $27,900 |
| 2020 | $3,234 | $44,340 | $20,040 | $24,300 |
| 2019 | $6,100 | $39,000 | $20,040 | $18,960 |
| 2016 | $5,378 | $26,900 | $16,577 | $10,323 |
| 2015 | $3,244 | $25,758 | $17,119 | $8,639 |
| 2014 | $3,244 | $24,300 | $19,380 | $4,920 |
Source: Public Records
Map
Nearby Homes
- 3104 Snyder Ave
- 1505 Nostrand Ave Unit 1509
- 1515 Nostrand Ave
- 14 E 32nd St
- 1020 New York Ave Unit MULTI
- 1022 New York Ave Unit MULTI
- 3120 Church Ave
- 941 New York Ave
- 1044 New York Ave
- 3400 Snyder Ave Unit 5E
- 3400 Snyder Ave Unit 4M
- 3400 Snyder Ave Unit 2R
- 282 E 35th St Unit 4W
- 282 E 35th St Unit 4U
- 282 E 35th St Unit 7V
- 220 E 34th St
- 201 E 35th St
- 335 Martense St
- 3500 Snyder Ave Unit 2P
- 3500 Snyder Ave Unit 6A
- 3117 Snyder Ave Unit 2
- 3121 Snyder Ave
- 3115 Snyder Ave
- 3123 Snyder Ave
- 3113 Snyder Ave
- 3111 Snyder Ave
- 58 E 32nd St
- 58 E 32nd St Unit 2
- 58 E 32 Nd St Unit 2
- 56 E 32 Nd St
- 56 E 32 Nd St
- 3109 Snyder Ave
- 56 E 32nd St
- 3105 Snyder Ave
- 54 E 32nd St
- 55 E 31st St
- 3103 Snyder Ave
- 3103 Snyder Ave
- 3103 Snyder Ave
- 3103 Snyder Ave