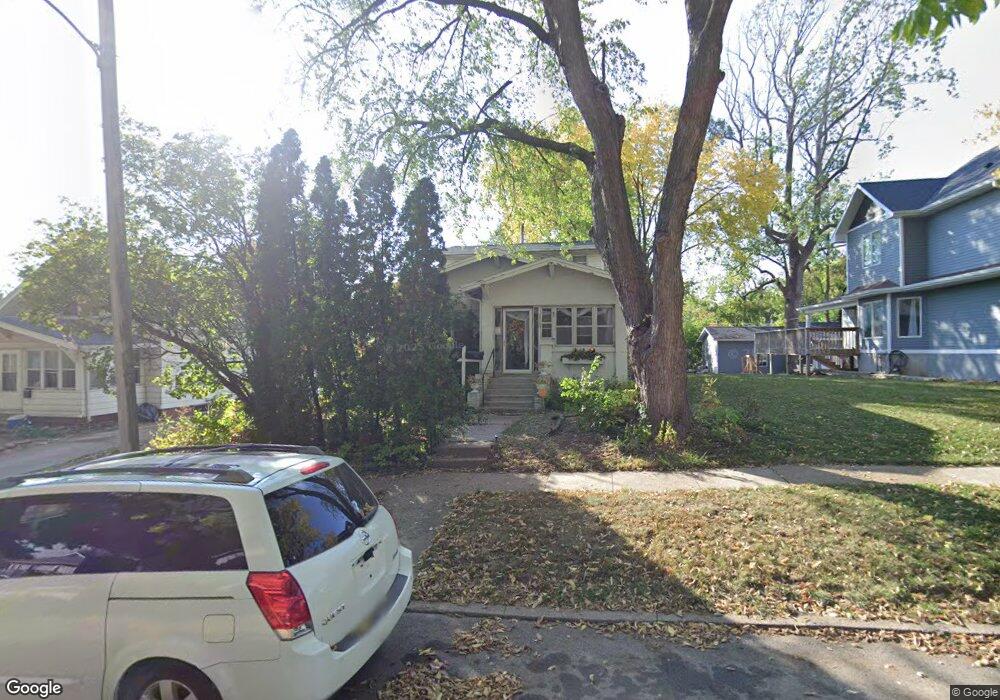
3118 3rd St Des Moines, IA 50313
Highland Park NeighborhoodEstimated Value: $153,049 - $185,000
2
Beds
1
Bath
1,246
Sq Ft
$133/Sq Ft
Est. Value
About This Home
This home is located at 3118 3rd St, Des Moines, IA 50313 and is currently estimated at $165,262, approximately $132 per square foot. 3118 3rd St is a home located in Polk County with nearby schools including Oak Park Elementary School, Harding Middle School, and North High School.
Ownership History
Date
Name
Owned For
Owner Type
Purchase Details
Closed on
Feb 9, 2005
Sold by
Mcfaul Irene M and Stover Terry L
Bought by
Edwards Margaret Lundt
Current Estimated Value
Home Financials for this Owner
Home Financials are based on the most recent Mortgage that was taken out on this home.
Original Mortgage
$75,000
Outstanding Balance
$37,941
Interest Rate
5.78%
Mortgage Type
Fannie Mae Freddie Mac
Estimated Equity
$127,321
Create a Home Valuation Report for This Property
The Home Valuation Report is an in-depth analysis detailing your home's value as well as a comparison with similar homes in the area
Home Values in the Area
Average Home Value in this Area
Purchase History
| Date | Buyer | Sale Price | Title Company |
|---|---|---|---|
| Edwards Margaret Lundt | $74,500 | -- |
Source: Public Records
Mortgage History
| Date | Status | Borrower | Loan Amount |
|---|---|---|---|
| Open | Edwards Margaret Lundt | $75,000 |
Source: Public Records
Tax History Compared to Growth
Tax History
| Year | Tax Paid | Tax Assessment Tax Assessment Total Assessment is a certain percentage of the fair market value that is determined by local assessors to be the total taxable value of land and additions on the property. | Land | Improvement |
|---|---|---|---|---|
| 2025 | $2,342 | $149,100 | $29,100 | $120,000 |
| 2024 | $2,342 | $129,500 | $25,200 | $104,300 |
| 2023 | $2,258 | $129,500 | $25,200 | $104,300 |
| 2022 | $2,240 | $104,700 | $21,300 | $83,400 |
| 2021 | $2,102 | $104,700 | $21,300 | $83,400 |
| 2020 | $2,178 | $92,800 | $19,100 | $73,700 |
| 2019 | $2,064 | $92,800 | $19,100 | $73,700 |
| 2018 | $2,038 | $85,300 | $17,400 | $67,900 |
| 2017 | $1,852 | $85,300 | $17,400 | $67,900 |
| 2016 | $1,800 | $77,000 | $15,600 | $61,400 |
| 2015 | $1,800 | $77,000 | $15,600 | $61,400 |
| 2014 | $1,598 | $71,300 | $14,400 | $56,900 |
Source: Public Records
Map
Nearby Homes