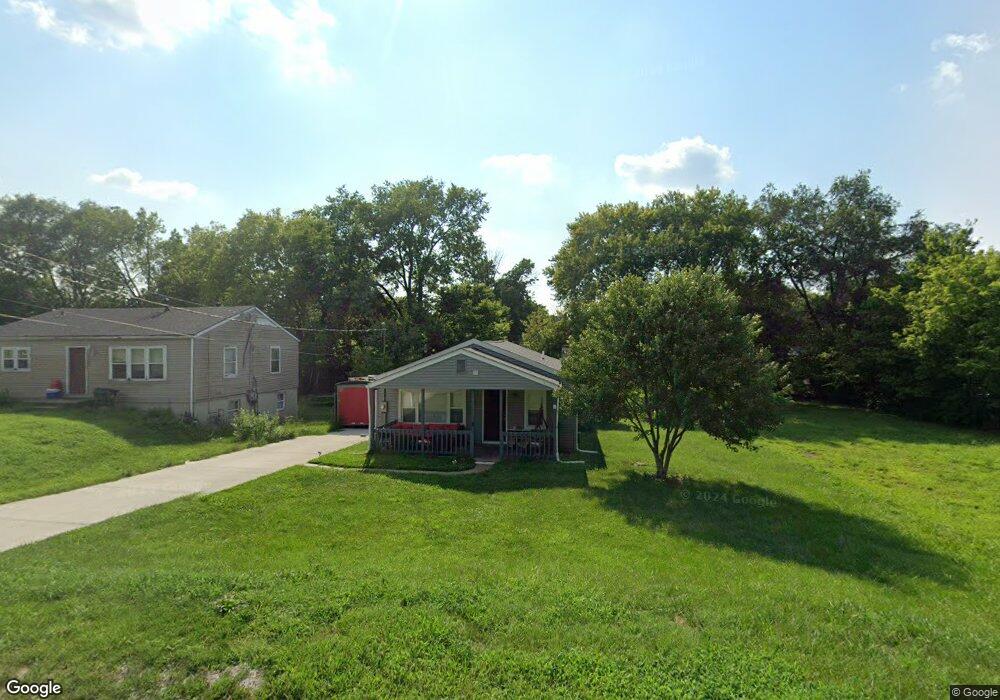
3118 Andrew St Middletown, OH 45044
Amanda-Oneida NeighborhoodEstimated Value: $108,189 - $194,000
3
Beds
2
Baths
1,164
Sq Ft
$124/Sq Ft
Est. Value
About This Home
This home is located at 3118 Andrew St, Middletown, OH 45044 and is currently estimated at $143,797, approximately $123 per square foot. 3118 Andrew St is a home located in Butler County with nearby schools including Amanda Elementary School, Highview 6th Grade Center, and Middletown Middle School.
Ownership History
Date
Name
Owned For
Owner Type
Purchase Details
Closed on
May 16, 2024
Sold by
Lre 1 Llc
Bought by
Stronghold Properties One Series Llc
Current Estimated Value
Purchase Details
Closed on
Oct 3, 2022
Sold by
Loren Real Estate Llc
Bought by
Lre 1 Llc
Purchase Details
Closed on
May 14, 2021
Sold by
Green Jonathan W
Bought by
Loren Real Estate Llc
Purchase Details
Closed on
Mar 22, 2012
Sold by
Honchul Shannon E and Green Shannon E
Bought by
Green Jonathan W
Purchase Details
Closed on
Mar 18, 2009
Sold by
Green Gerald F and Green Donna C
Bought by
Green Jonathan W and Green Shannon E
Purchase Details
Closed on
May 1, 1989
Create a Home Valuation Report for This Property
The Home Valuation Report is an in-depth analysis detailing your home's value as well as a comparison with similar homes in the area
Home Values in the Area
Average Home Value in this Area
Purchase History
| Date | Buyer | Sale Price | Title Company |
|---|---|---|---|
| Stronghold Properties One Series Llc | -- | None Listed On Document | |
| Stronghold Properties One Series Llc | -- | None Listed On Document | |
| Lre 1 Llc | -- | -- | |
| Lre 1 Llc | -- | None Listed On Document | |
| Loren Real Estate Llc | $22,100 | None Available | |
| Green Jonathan W | -- | None Available | |
| Green Jonathan W | -- | Attorney | |
| -- | $25,700 | -- |
Source: Public Records
Tax History Compared to Growth
Tax History
| Year | Tax Paid | Tax Assessment Tax Assessment Total Assessment is a certain percentage of the fair market value that is determined by local assessors to be the total taxable value of land and additions on the property. | Land | Improvement |
|---|---|---|---|---|
| 2024 | $935 | $17,650 | $5,220 | $12,430 |
| 2023 | $930 | $17,650 | $5,220 | $12,430 |
| 2022 | $0 | $7,250 | $5,220 | $2,030 |
| 2021 | $0 | $7,250 | $5,220 | $2,030 |
| 2020 | $640 | $15,270 | $5,220 | $10,050 |
| 2019 | $918 | $12,670 | $5,340 | $7,330 |
| 2018 | $247 | $12,670 | $5,340 | $7,330 |
| 2017 | $248 | $12,670 | $5,340 | $7,330 |
| 2016 | $153 | $11,070 | $5,340 | $5,730 |
| 2015 | $151 | $11,070 | $5,340 | $5,730 |
| 2014 | $1,853 | $11,070 | $5,340 | $5,730 |
| 2013 | $1,853 | $16,250 | $5,340 | $10,910 |
Source: Public Records
Map
Nearby Homes
- 3106 Finley St
- 3113 Rufus St
- 3220 Finley St
- 1613 Sheridan Ave
- 1602 Oxford State Rd
- 1709 Oxford State Rd
- 1505 Pershing Ave
- 1507 Pershing Ave
- 1309 Oxford State Rd
- 3222 Mohawk St
- 2012 Oneka Ave
- 3102 Omaha St
- 3003 Judy Dr
- 3111 Omaha St
- 3007 Omaha St
- 0 Jackson St Unit 895859
- 0 Jackson St Unit 1780028
- 1808 Meadow Ave
- 1511 Meadow Ave
- 1509 Meadow Ave