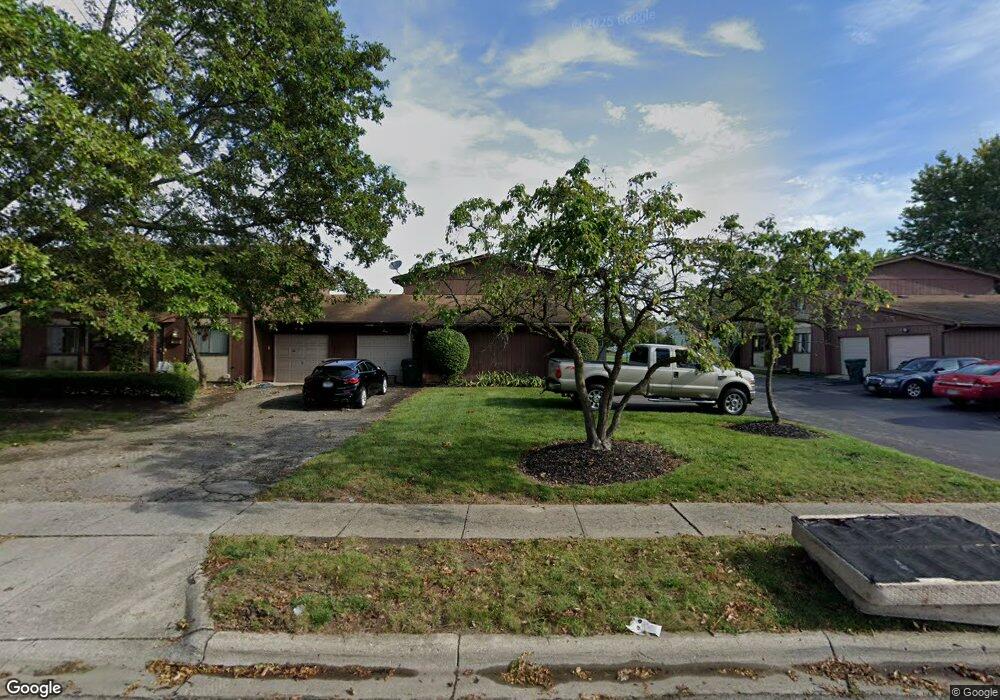
3118 Easthaven Dr S Unit 7D Columbus, OH 43232
Glenbrook NeighborhoodEstimated Value: $107,000 - $124,000
2
Beds
2
Baths
1,178
Sq Ft
$97/Sq Ft
Est. Value
About This Home
This home is located at 3118 Easthaven Dr S Unit 7D, Columbus, OH 43232 and is currently estimated at $113,770, approximately $96 per square foot. 3118 Easthaven Dr S Unit 7D is a home located in Franklin County with nearby schools including Easthaven Elementary School, Yorktown Middle School, and Independence High School.
Ownership History
Date
Name
Owned For
Owner Type
Purchase Details
Closed on
May 16, 2024
Sold by
Risley Real Estate 1 Llc
Bought by
Wright Charlotte
Current Estimated Value
Purchase Details
Closed on
Jan 12, 2022
Sold by
Ganim Real Estate 1 Llc
Bought by
Risley Real Estate 1 Llc
Purchase Details
Closed on
Aug 9, 2013
Sold by
Ganim Douglas J
Bought by
Ganim Real Estate 1 Llc
Purchase Details
Closed on
May 4, 2006
Sold by
Day Kenneth L
Bought by
Ganim Douglas J
Purchase Details
Closed on
Oct 7, 1997
Sold by
Elkins Timothy W and Elkins Michele R
Bought by
Day Eileen and Day Kenneth L
Purchase Details
Closed on
Jun 24, 1992
Purchase Details
Closed on
Mar 19, 1992
Create a Home Valuation Report for This Property
The Home Valuation Report is an in-depth analysis detailing your home's value as well as a comparison with similar homes in the area
Home Values in the Area
Average Home Value in this Area
Purchase History
| Date | Buyer | Sale Price | Title Company |
|---|---|---|---|
| Wright Charlotte | $100,000 | Powell Title | |
| Wright Charlotte | $100,000 | Powell Title | |
| Risley Real Estate 1 Llc | $75,000 | Great American Title | |
| Risley Real Estate 1 Llc | $75,000 | Great American Title | |
| Ganim Real Estate 1 Llc | -- | None Available | |
| Ganim Real Estate 1 Llc | -- | None Available | |
| Ganim Douglas J | $40,000 | None Available | |
| Ganim Douglas J | $40,000 | None Available | |
| Day Eileen | $48,900 | Title First Agency Inc | |
| Day Eileen | $48,900 | Title First Agency Inc | |
| -- | $19,000 | -- | |
| -- | $19,000 | -- | |
| -- | -- | -- | |
| -- | -- | -- |
Source: Public Records
Mortgage History
| Date | Status | Borrower | Loan Amount |
|---|---|---|---|
| Closed | Day Eileen | $0 |
Source: Public Records
Tax History Compared to Growth
Tax History
| Year | Tax Paid | Tax Assessment Tax Assessment Total Assessment is a certain percentage of the fair market value that is determined by local assessors to be the total taxable value of land and additions on the property. | Land | Improvement |
|---|---|---|---|---|
| 2024 | $1,100 | $24,010 | $5,250 | $18,760 |
| 2023 | $1,237 | $24,010 | $5,250 | $18,760 |
| 2022 | $871 | $10,920 | $630 | $10,290 |
| 2021 | $581 | $10,920 | $630 | $10,290 |
| 2020 | $582 | $10,920 | $630 | $10,290 |
| 2019 | $566 | $9,110 | $530 | $8,580 |
| 2018 | $635 | $9,110 | $530 | $8,580 |
| 2017 | $566 | $9,110 | $530 | $8,580 |
| 2016 | $773 | $11,380 | $1,750 | $9,630 |
| 2015 | $704 | $11,380 | $1,750 | $9,630 |
| 2014 | $706 | $11,380 | $1,750 | $9,630 |
| 2013 | $348 | $11,375 | $1,750 | $9,625 |
Source: Public Records
Map
Nearby Homes
- 3036 Wadsworth Ct
- 3038 Wadsworth Ct
- 3054 Wadsworth Ct
- 2252 Meridian Ct
- 3365 Bruceton Ave
- 0 Ravenswood Ct
- 2275 Cardston Ct
- 2971 Queensrowe Dr
- 2425 Mason Village Ct Unit 2425
- 1782 Newfield Rd
- 2825 S Hampton Rd
- 3830 Charbonnett Ct Unit 6-A
- 3105 Wessex Ct
- 2472 Nassau Dr Unit 37D
- 0 Wessex Ct
- 3325 E Deshler Ave
- 3246 E Deshler Ave
- 1664 Barnett Rd
- 2840 Manola Dr
- 3811 Bay Village St
- 3118 Easthaven Dr S Unit D
- 3120 Easthaven Dr S Unit C7
- 3120 Easthaven Dr S Unit C
- 3116 Easthaven Dr S
- 3116 Easthaven Dr S Unit A
- 3114 Easthaven Dr S
- 3124 Easthaven Dr S Unit 8A
- 3124 Easthaven Dr S Unit A
- 3122 Easthaven Dr S
- 3112 Easthaven Dr S Unit 6C
- 3112 Easthaven Dr S Unit C
- 3117 Rotunda Ct S Unit 131
- 3110 Easthaven Dr S Unit 6D
- 3126 Easthaven Dr S Unit 8D
- 2252 Wadsworth Dr
- 2250 Wadsworth Dr Unit 6B
- 2250 Wadsworth Dr Unit B
- 3128 Easthaven Dr S Unit 8C
- 3133 Rotunda Ct S Unit 135
- 3111 Easthaven Dr S