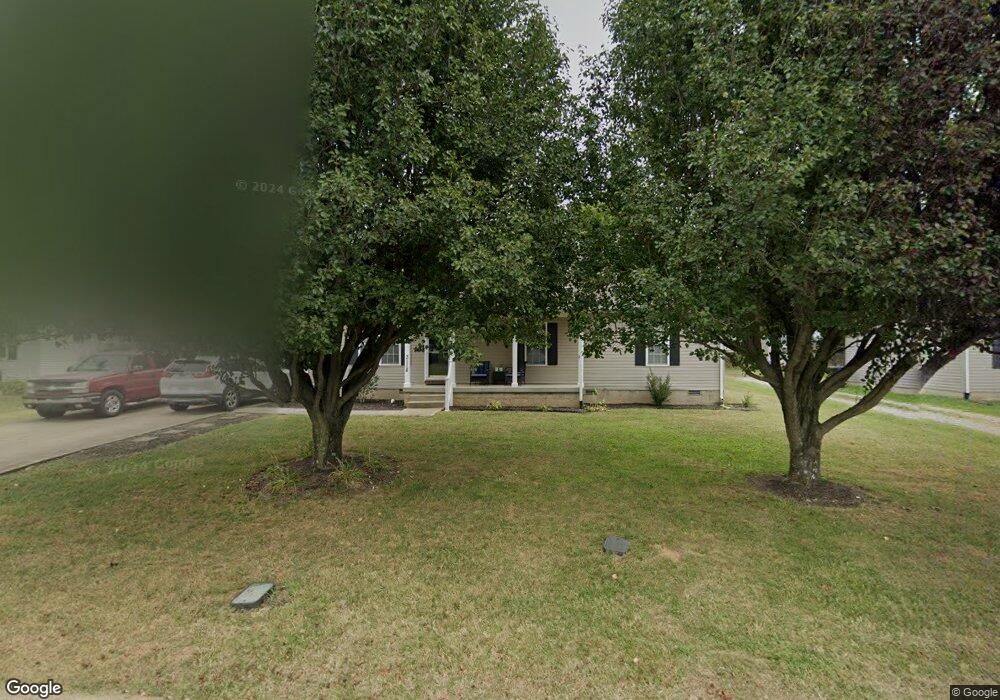
3118 Penny Ln Murfreesboro, TN 37130
Estimated Value: $386,000 - $427,000
4
Beds
3
Baths
2,478
Sq Ft
$165/Sq Ft
Est. Value
About This Home
This home is located at 3118 Penny Ln, Murfreesboro, TN 37130 and is currently estimated at $408,611, approximately $164 per square foot. 3118 Penny Ln is a home located in Rutherford County with nearby schools including Erma Siegel Elementary School, Lascassas Elementary School, and Oakland Middle School.
Ownership History
Date
Name
Owned For
Owner Type
Purchase Details
Closed on
Jun 25, 2018
Sold by
Stackhouse Deborah A
Bought by
Stackhouse Timmy C and Stackhouse Deborah A
Current Estimated Value
Home Financials for this Owner
Home Financials are based on the most recent Mortgage that was taken out on this home.
Original Mortgage
$198,921
Outstanding Balance
$172,776
Interest Rate
4.6%
Mortgage Type
FHA
Estimated Equity
$235,835
Purchase Details
Closed on
Jan 27, 2016
Sold by
Erskine Deborah A
Bought by
Stackhouse Deborah A
Purchase Details
Closed on
Jun 7, 2002
Sold by
Erskine Kevin D
Bought by
Erskine Deborah A
Purchase Details
Closed on
Mar 29, 1996
Sold by
Jones Construction Co
Bought by
Erskine and Deborah
Purchase Details
Closed on
Jan 6, 1995
Bought by
Jones Construction Co
Create a Home Valuation Report for This Property
The Home Valuation Report is an in-depth analysis detailing your home's value as well as a comparison with similar homes in the area
Home Values in the Area
Average Home Value in this Area
Purchase History
| Date | Buyer | Sale Price | Title Company |
|---|---|---|---|
| Stackhouse Timmy C | -- | Foundation Title & Escrow | |
| Stackhouse Deborah A | -- | -- | |
| Erskine Deborah A | -- | -- | |
| Erskine | $86,900 | -- | |
| Jones Construction Co | $145,000 | -- |
Source: Public Records
Mortgage History
| Date | Status | Borrower | Loan Amount |
|---|---|---|---|
| Open | Stackhouse Timmy C | $198,921 |
Source: Public Records
Tax History Compared to Growth
Tax History
| Year | Tax Paid | Tax Assessment Tax Assessment Total Assessment is a certain percentage of the fair market value that is determined by local assessors to be the total taxable value of land and additions on the property. | Land | Improvement |
|---|---|---|---|---|
| 2025 | $2,043 | $72,225 | $13,750 | $58,475 |
| 2024 | $2,043 | $72,225 | $13,750 | $58,475 |
| 2023 | $1,327 | $70,750 | $13,750 | $57,000 |
| 2022 | $1,143 | $70,750 | $13,750 | $57,000 |
| 2021 | $998 | $44,975 | $8,125 | $36,850 |
| 2020 | $998 | $44,975 | $8,125 | $36,850 |
| 2019 | $998 | $44,975 | $8,125 | $36,850 |
| 2018 | $1,371 | $44,975 | $0 | $0 |
| 2017 | $1,243 | $31,975 | $0 | $0 |
| 2016 | $1,243 | $31,975 | $0 | $0 |
| 2015 | $1,243 | $31,975 | $0 | $0 |
| 2014 | $795 | $31,975 | $0 | $0 |
| 2013 | -- | $32,425 | $0 | $0 |
Source: Public Records
Map
Nearby Homes
- 3214 Penny Ln
- 2914 Kedzie Dr
- 2918 Meadowhill Dr
- 0 Compton Rd
- 2906 Meadowhill Dr
- 1168 Gardendale Dr
- 1013 Wigan Dr
- 3122 Rift Ln
- 3154 Rift Ln
- 1817 Splash Place
- 849 Arbon Vale Dr
- 1197 Compton Rd
- 3316 Livermore Ln
- 3406 Meadowhill Dr
- 3322 Livermore Ln
- 3414 Dench Dr
- 3306 Rift Ln
- 810 Corlew St
- 809 Old Blue Ln
- 3441 Dench Dr