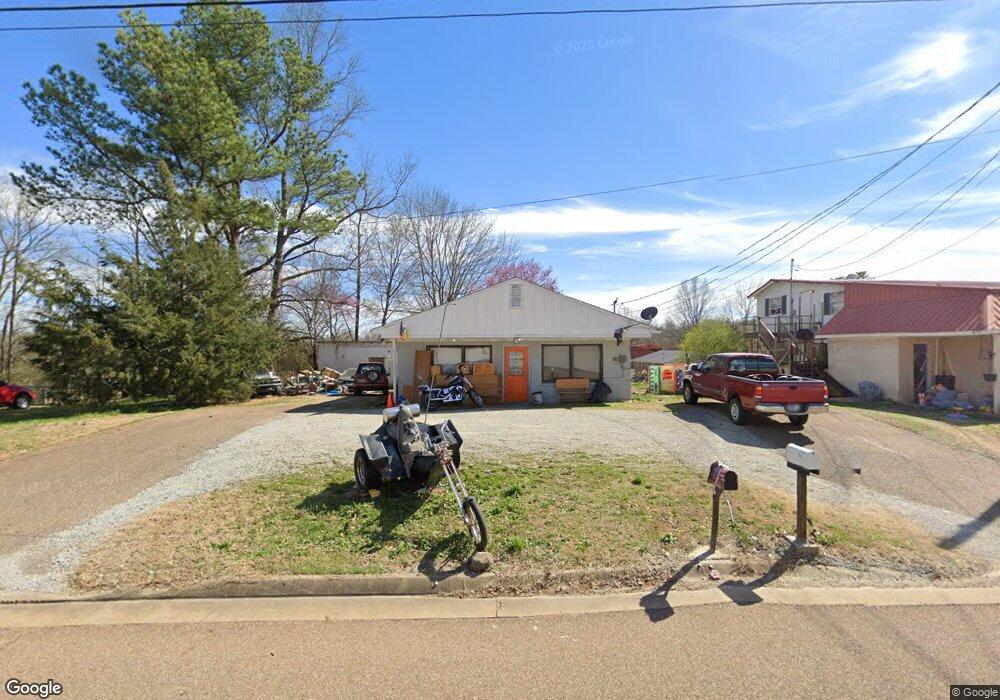
3119 U S 412 Parsons, TN 38363
Estimated Value: $94,732
1
Bed
1
Bath
1,328
Sq Ft
$71/Sq Ft
Est. Value
About This Home
This home is located at 3119 U S 412, Parsons, TN 38363 and is currently priced at $94,732, approximately $71 per square foot. 3119 U S 412 is a home located in Decatur County with nearby schools including Parsons Elementary School, Decaturville Elementary School, and Decatur County Middle School.
Ownership History
Date
Name
Owned For
Owner Type
Purchase Details
Closed on
Oct 16, 2025
Sold by
Aycock Johnny
Bought by
Patmans Trust and Nes Van
Current Estimated Value
Purchase Details
Closed on
Oct 14, 2022
Sold by
Mccomic Robert
Bought by
Aycock Johnny
Home Financials for this Owner
Home Financials are based on the most recent Mortgage that was taken out on this home.
Original Mortgage
$80,000
Interest Rate
5.66%
Mortgage Type
Seller Take Back
Purchase Details
Closed on
Feb 23, 2012
Sold by
Ball Saundra
Bought by
Mccomic Robert W
Purchase Details
Closed on
Aug 12, 2008
Sold by
Baker Dianne
Bought by
Ball Saundra
Home Financials for this Owner
Home Financials are based on the most recent Mortgage that was taken out on this home.
Original Mortgage
$42,000
Interest Rate
6.21%
Mortgage Type
Commercial
Purchase Details
Closed on
Dec 1, 2005
Bought by
Baker Dianne
Purchase Details
Closed on
Jul 15, 1998
Sold by
Brewington John
Bought by
Hicks Allyse
Purchase Details
Closed on
Oct 14, 1985
Bought by
Brewington John and Brewington Ann
Create a Home Valuation Report for This Property
The Home Valuation Report is an in-depth analysis detailing your home's value as well as a comparison with similar homes in the area
Home Values in the Area
Average Home Value in this Area
Purchase History
| Date | Buyer | Sale Price | Title Company |
|---|---|---|---|
| Patmans Trust | $33,000 | None Listed On Document | |
| Aycock Johnny | $80,000 | -- | |
| Mccomic Robert W | $35,000 | -- | |
| Ball Saundra | $42,500 | -- | |
| Baker Dianne | $35,000 | -- | |
| Hicks Allyse | $22,000 | -- | |
| Brewington John | -- | -- |
Source: Public Records
Mortgage History
| Date | Status | Borrower | Loan Amount |
|---|---|---|---|
| Previous Owner | Aycock Johnny | $80,000 | |
| Previous Owner | Brewington John | $42,000 |
Source: Public Records
Tax History Compared to Growth
Tax History
| Year | Tax Paid | Tax Assessment Tax Assessment Total Assessment is a certain percentage of the fair market value that is determined by local assessors to be the total taxable value of land and additions on the property. | Land | Improvement |
|---|---|---|---|---|
| 2025 | $210 | $19,080 | $0 | $0 |
| 2024 | $210 | $8,150 | $875 | $7,275 |
| 2023 | $210 | $8,150 | $875 | $7,275 |
| 2022 | $210 | $8,150 | $875 | $7,275 |
| 2021 | $210 | $8,150 | $875 | $7,275 |
| 2020 | $210 | $8,150 | $875 | $7,275 |
| 2019 | $148 | $6,575 | $875 | $5,700 |
| 2018 | $131 | $6,575 | $875 | $5,700 |
| 2017 | $131 | $6,575 | $875 | $5,700 |
| 2016 | $131 | $6,575 | $875 | $5,700 |
| 2015 | $131 | $6,575 | $875 | $5,700 |
| 2014 | $131 | $6,576 | $0 | $0 |
Source: Public Records
Map
Nearby Homes
- 2935 U S 412
- 2880 U S 412
- 1035 Beacon Rd
- 1176 Myracle Town Rd
- 320 Wilkinstown Rd
- 0 Wilkinstown Rd
- 0 Darden Rd Unit RTC2969151
- 0 Darden Rd Unit 10202884
- 145 Darden Ln
- 000 Darden Christian Chapel Rd
- 869 W 4th St
- 174 Grice Ln
- 545 W 4th St
- 185 Corinth Rd
- 000 Hwy 412 E
- x Highway 641 Hwy
- 91 E 2nd St
- 41 E 7th St
- 724 Tennessee Ave S
- 3131 U S 412
- 53 Beacon Rd
- 3062 Highway 412 W
- 3069 Us Highway 412 W
- 3093 Us Highway 412 W
- 94 Beacon Rd
- 3178 Highway 412 W
- 50 Box Rd
- 116 Beacon Rd
- 3200 Highway 412 W
- 3234 Us Highway 412 W
- 3235 Highway 412 W
- 66 Old Parsons Ln
- 110 Box Rd
- 2935 Highway 412 W
- 114 Old Parsons Ln
- 2970 Highway 412 W
- 180 Beacon Rd
- 3294 Highway 412 W
- 78 Flowers Cove