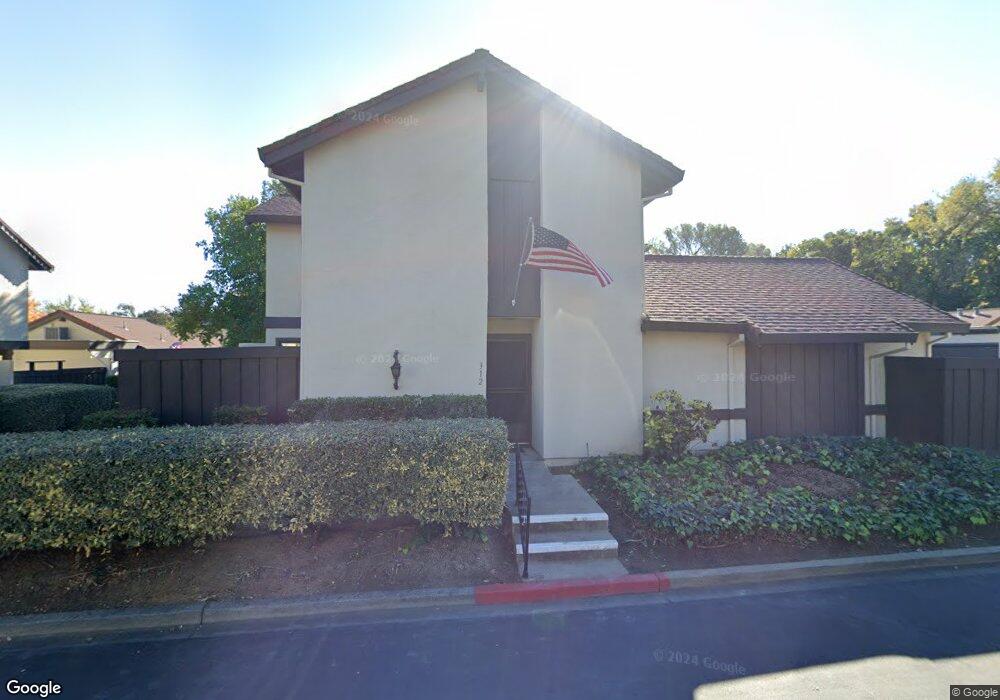
312 Acorn Ct Vacaville, CA 95688
Estimated Value: $408,000 - $464,000
2
Beds
3
Baths
1,369
Sq Ft
$324/Sq Ft
Est. Value
About This Home
This home is located at 312 Acorn Ct, Vacaville, CA 95688 and is currently estimated at $443,384, approximately $323 per square foot. 312 Acorn Ct is a home located in Solano County with nearby schools including Alamo Elementary School, Orchard Elementary School, and Willis Jepson Middle School.
Ownership History
Date
Name
Owned For
Owner Type
Purchase Details
Closed on
Feb 27, 2019
Sold by
Lipekeruinn Anne E
Bought by
Kent Deborah and Smith Jack Martin
Current Estimated Value
Home Financials for this Owner
Home Financials are based on the most recent Mortgage that was taken out on this home.
Original Mortgage
$310,660
Outstanding Balance
$242,501
Interest Rate
4.4%
Mortgage Type
New Conventional
Estimated Equity
$200,883
Purchase Details
Closed on
Feb 25, 2019
Sold by
Quinn Walter
Bought by
Lipska Quinn Anne E
Home Financials for this Owner
Home Financials are based on the most recent Mortgage that was taken out on this home.
Original Mortgage
$310,660
Outstanding Balance
$242,501
Interest Rate
4.4%
Mortgage Type
New Conventional
Estimated Equity
$200,883
Purchase Details
Closed on
Dec 31, 1991
Sold by
Lipski Wanda W
Bought by
Lipski Wanda W and Lipska Quinn Anne E
Create a Home Valuation Report for This Property
The Home Valuation Report is an in-depth analysis detailing your home's value as well as a comparison with similar homes in the area
Home Values in the Area
Average Home Value in this Area
Purchase History
| Date | Buyer | Sale Price | Title Company |
|---|---|---|---|
| Kent Deborah | $327,000 | Old Republic Epn | |
| Lipska Quinn Anne E | -- | Old Republic Epn | |
| Lipski Wanda W | -- | -- |
Source: Public Records
Mortgage History
| Date | Status | Borrower | Loan Amount |
|---|---|---|---|
| Open | Kent Deborah | $310,660 |
Source: Public Records
Tax History Compared to Growth
Tax History
| Year | Tax Paid | Tax Assessment Tax Assessment Total Assessment is a certain percentage of the fair market value that is determined by local assessors to be the total taxable value of land and additions on the property. | Land | Improvement |
|---|---|---|---|---|
| 2025 | $4,115 | $364,771 | $78,083 | $286,688 |
| 2024 | $4,115 | $357,619 | $76,552 | $281,067 |
| 2023 | $4,017 | $350,607 | $75,051 | $275,556 |
| 2022 | $3,911 | $343,733 | $73,581 | $270,152 |
| 2021 | $3,917 | $336,994 | $72,139 | $264,855 |
| 2020 | $3,864 | $333,540 | $71,400 | $262,140 |
| 2019 | $1,895 | $166,268 | $35,000 | $131,268 |
| 2018 | $1,873 | $163,009 | $34,314 | $128,695 |
| 2017 | $1,809 | $159,814 | $33,642 | $126,172 |
| 2016 | $1,792 | $156,682 | $32,983 | $123,699 |
| 2015 | $1,768 | $154,329 | $32,488 | $121,841 |
| 2014 | $1,655 | $151,307 | $31,852 | $119,455 |
Source: Public Records
Map
Nearby Homes
- 149 Fairoaks Dr
- 569 Alamo Dr
- 680 S Orchard Ave
- 491 Rosso Ct
- 325 Gabiano Ct
- 571 Nottingham Dr
- 376 Bishop Dr
- 373 Lovers Ln
- 325 Marshall Rd
- 632 Cordelia Cir
- 491 Buck Ave
- 0 Merchant St Unit 325089259
- 731 La Cruz Ln
- 678 Claremont Dr
- 1217 Alderwood Way
- 1221 Devonshire Dr
- 149 Mason St
- 253 W Kendal St
- 124 Main St
- 101 Main St