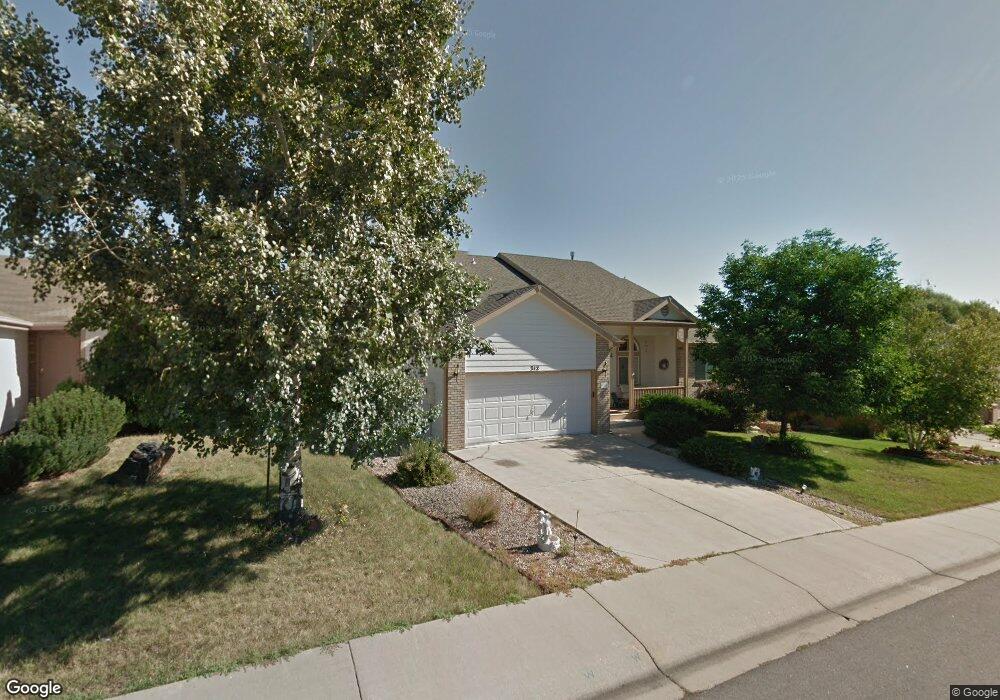
312 Dunne Dr Fort Collins, CO 80525
Huntington Hills NeighborhoodEstimated Value: $503,000 - $607,000
3
Beds
2
Baths
1,528
Sq Ft
$365/Sq Ft
Est. Value
About This Home
This home is located at 312 Dunne Dr, Fort Collins, CO 80525 and is currently estimated at $558,192, approximately $365 per square foot. 312 Dunne Dr is a home located in Larimer County with nearby schools including Werner Elementary School, Preston Middle School, and Fossil Ridge High School.
Ownership History
Date
Name
Owned For
Owner Type
Purchase Details
Closed on
Aug 9, 2022
Sold by
Mammoser Joseph G
Bought by
Joseph G Mammoser Trust
Current Estimated Value
Purchase Details
Closed on
May 30, 1997
Sold by
Lopezi Todd M and Lomoglio Salvatore J
Bought by
Mammoser Joseph G and Mammoser Mari L
Home Financials for this Owner
Home Financials are based on the most recent Mortgage that was taken out on this home.
Original Mortgage
$83,000
Interest Rate
8.17%
Purchase Details
Closed on
Aug 1, 1995
Sold by
Skeen Custom Homes Inc
Bought by
Lopezi Todd M
Purchase Details
Closed on
Mar 1, 1995
Sold by
Rossi Homes Inc
Bought by
Skeen Custom Homes Inc
Purchase Details
Closed on
Feb 1, 1995
Sold by
Rossi Michael Scott Dba
Bought by
Rossi Homes Inc
Purchase Details
Closed on
Sep 1, 1994
Sold by
Huntington Hills Corp Inc
Bought by
Huntington Hills Corp
Purchase Details
Closed on
Jun 1, 1994
Sold by
327006 Alberta Ltd
Bought by
Huntington Hills Corp Inc
Create a Home Valuation Report for This Property
The Home Valuation Report is an in-depth analysis detailing your home's value as well as a comparison with similar homes in the area
Home Values in the Area
Average Home Value in this Area
Purchase History
| Date | Buyer | Sale Price | Title Company |
|---|---|---|---|
| Joseph G Mammoser Trust | -- | None Listed On Document | |
| Mammoser Joseph G | $153,000 | -- | |
| Lopezi Todd M | $152,000 | -- | |
| Skeen Custom Homes Inc | $29,500 | -- | |
| Rossi Homes Inc | -- | -- | |
| Huntington Hills Corp | -- | -- | |
| Huntington Hills Corp Inc | $52,500 | -- |
Source: Public Records
Mortgage History
| Date | Status | Borrower | Loan Amount |
|---|---|---|---|
| Previous Owner | Mammoser Joseph G | $83,000 |
Source: Public Records
Tax History Compared to Growth
Tax History
| Year | Tax Paid | Tax Assessment Tax Assessment Total Assessment is a certain percentage of the fair market value that is determined by local assessors to be the total taxable value of land and additions on the property. | Land | Improvement |
|---|---|---|---|---|
| 2025 | $2,484 | $35,805 | $10,519 | $25,286 |
| 2024 | $2,367 | $35,805 | $10,519 | $25,286 |
| 2022 | $1,965 | $27,328 | $3,684 | $23,644 |
| 2021 | $1,986 | $28,114 | $3,790 | $24,324 |
| 2020 | $1,947 | $27,528 | $3,790 | $23,738 |
| 2019 | $1,955 | $27,528 | $3,790 | $23,738 |
| 2018 | $1,580 | $24,170 | $3,816 | $20,354 |
| 2017 | $1,575 | $24,170 | $3,816 | $20,354 |
| 2016 | $1,243 | $21,285 | $4,219 | $17,066 |
| 2015 | $1,234 | $23,160 | $4,220 | $18,940 |
| 2014 | $1,870 | $20,060 | $4,220 | $15,840 |
Source: Public Records
Map
Nearby Homes
- 306 Saturn Dr
- 433 Huntington Hills Dr
- 508 Shadbury Ct
- 5925 Auburn Dr
- 5942 Colby St
- 5509 Fossil Ridge Dr E
- 102 Fossil Ct W
- 5620 Fossil Creek Pkwy Unit 302
- 5620 Fossil Creek Pkwy Unit 3204
- 5620 Fossil Creek Pkwy Unit 2205
- 5620 Fossil Creek Pkwy Unit 6303
- 5902 Huntington Hills Dr
- 715 Yarnell Ct
- 5213 Castle Ridge Place
- 117 Cameron Dr
- 301 Uranus St
- 1118 Deercroft Ct
- 217 W Trilby Rd
- 6603 Autumn Ridge Dr Unit 2
- 1024 Belvedere Ct