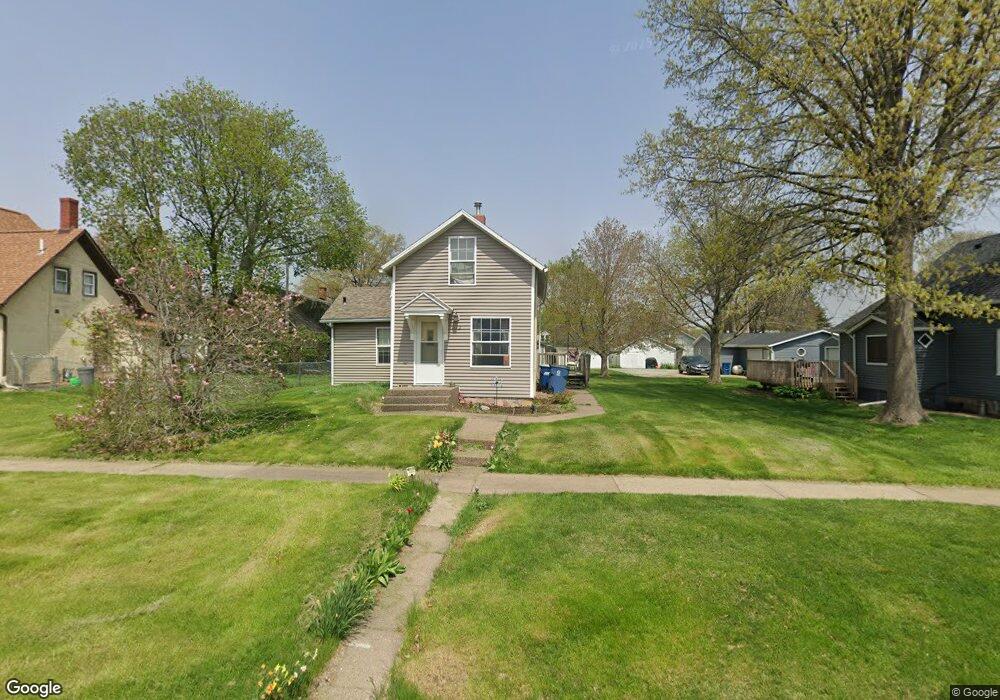
312 E Flagg St Walcott, IA 52773
Estimated Value: $131,000 - $168,000
2
Beds
1
Bath
1,012
Sq Ft
$147/Sq Ft
Est. Value
About This Home
This home is located at 312 E Flagg St, Walcott, IA 52773 and is currently estimated at $148,935, approximately $147 per square foot. 312 E Flagg St is a home located in Scott County with nearby schools including Walcott Elementary School, Walcott Intermediate School, and West High School.
Ownership History
Date
Name
Owned For
Owner Type
Purchase Details
Closed on
Sep 20, 2012
Sold by
Tooley Anthony K and Tooley Kasey A
Bought by
Kutcher Clinton J
Current Estimated Value
Home Financials for this Owner
Home Financials are based on the most recent Mortgage that was taken out on this home.
Original Mortgage
$82,650
Outstanding Balance
$57,190
Interest Rate
3.57%
Mortgage Type
New Conventional
Estimated Equity
$91,745
Purchase Details
Closed on
May 26, 2011
Sold by
Alvarez Sonny T and Alvarez Amy
Bought by
Tooley Anthony K
Home Financials for this Owner
Home Financials are based on the most recent Mortgage that was taken out on this home.
Original Mortgage
$89,119
Interest Rate
4.96%
Mortgage Type
New Conventional
Purchase Details
Closed on
Mar 1, 2005
Sold by
Ankney Robert J and Harksen Lisa R
Bought by
Alvarez Sonny T
Home Financials for this Owner
Home Financials are based on the most recent Mortgage that was taken out on this home.
Original Mortgage
$82,000
Interest Rate
5.71%
Mortgage Type
New Conventional
Create a Home Valuation Report for This Property
The Home Valuation Report is an in-depth analysis detailing your home's value as well as a comparison with similar homes in the area
Purchase History
| Date | Buyer | Sale Price | Title Company |
|---|---|---|---|
| Kutcher Clinton J | $87,000 | None Available | |
| Tooley Anthony K | $86,000 | None Available | |
| Alvarez Sonny T | $82,000 | None Available |
Source: Public Records
Mortgage History
| Date | Status | Borrower | Loan Amount |
|---|---|---|---|
| Open | Kutcher Clinton J | $82,650 | |
| Previous Owner | Tooley Anthony K | $89,119 | |
| Previous Owner | Alvarez Sonny T | $82,000 |
Source: Public Records
Tax History
| Year | Tax Paid | Tax Assessment Tax Assessment Total Assessment is a certain percentage of the fair market value that is determined by local assessors to be the total taxable value of land and additions on the property. | Land | Improvement |
|---|---|---|---|---|
| 2025 | $1,880 | $132,700 | $24,000 | $108,700 |
| 2024 | $1,848 | $128,600 | $24,000 | $104,600 |
| 2023 | $1,808 | $128,600 | $24,000 | $104,600 |
| 2022 | $1,796 | $100,890 | $16,640 | $84,250 |
| 2021 | $1,796 | $100,890 | $16,640 | $84,250 |
| 2020 | $1,522 | $90,080 | $16,640 | $73,440 |
| 2019 | $1,570 | $84,650 | $12,800 | $71,850 |
| 2018 | $1,538 | $84,650 | $12,800 | $71,850 |
| 2017 | $471 | $84,650 | $12,800 | $71,850 |
| 2016 | $1,392 | $76,640 | $0 | $0 |
| 2015 | $1,392 | $73,280 | $0 | $0 |
| 2014 | $1,352 | $73,280 | $0 | $0 |
| 2013 | $1,330 | $0 | $0 | $0 |
| 2012 | -- | $73,450 | $12,800 | $60,650 |
Source: Public Records
Map
Nearby Homes
- 423 S Grove St
- 330 N Main St
- 781 W Walcott Rd Unit 182
- 0 W Lauretta St
- 501 Prairie Meadow Dr
- 508 Prairie Meadow Dr
- 0000 N Oak Ln
- 213 E Mayne St
- 221 W Meuse St
- 305 Walker Way
- 444 Celeste Cir
- 00 Verde Ave
- 0 Verde Ave
- 1519 Wildlife Dr
- 1517 Wildlife Dr
- 1518 Wildlife Dr
- 1526 Wildlife Dr
- 1528 Wildlife Dr
- 1530 Wildlife Dr
- 1520 Wildlife Dr
- 322 E Flagg St
- 302 E Flagg St
- 335 S Downey St
- 330 E Flagg St
- 313 E Durant St
- 305 E Durant St
- 325 E Durant St
- 344 E Flagg St
- 333 E Durant St
- 321 E Flagg St
- 309 E Flagg St
- 340 S Downey St
- 257 E Flagg St
- 345 E Flagg St
- 341 E Durant St
- 0000 E Durant St
- 000000 E Durant St
- 247 E Flagg St
- 233 E Durant St
- 340 E Memorial Rd
Your Personal Tour Guide
Ask me questions while you tour the home.