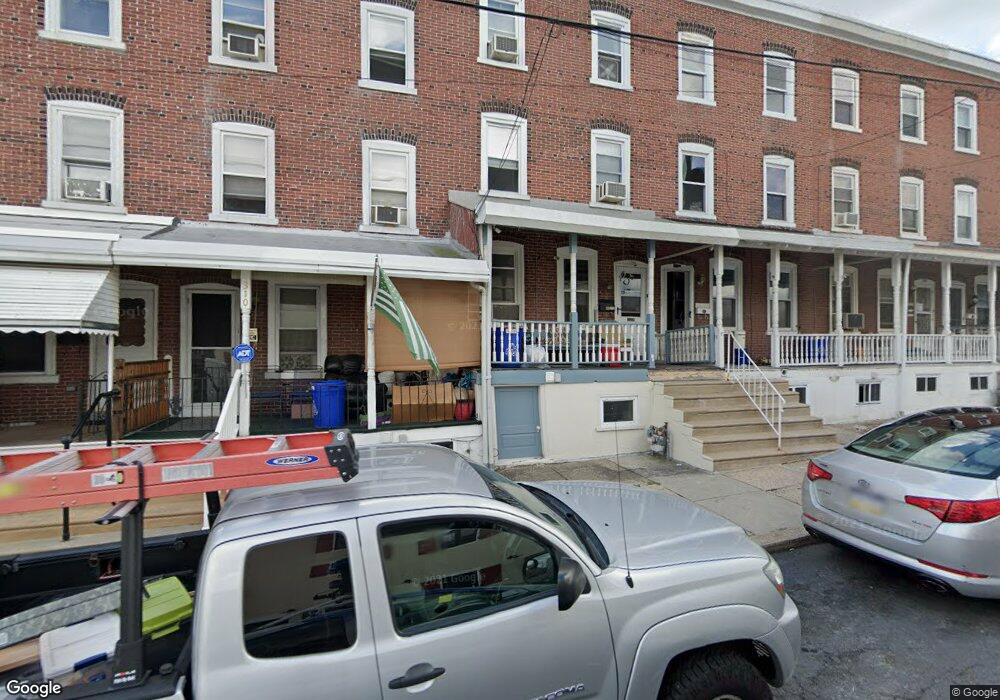
312 Grove St Unit 24 Bridgeport, PA 19405
Estimated Value: $250,002 - $311,000
5
Beds
1
Bath
1,920
Sq Ft
$150/Sq Ft
Est. Value
About This Home
This home is located at 312 Grove St Unit 24, Bridgeport, PA 19405 and is currently estimated at $287,251, approximately $149 per square foot. 312 Grove St Unit 24 is a home located in Montgomery County with nearby schools including Bridgeport Elementary School, Upper Merion Middle School, and Upper Merion High School.
Ownership History
Date
Name
Owned For
Owner Type
Purchase Details
Closed on
Jan 31, 1996
Sold by
Czarnecki Walter J and Czarnecki Donna
Bought by
Gundrum Anthony John and Gundrum Diane R
Current Estimated Value
Create a Home Valuation Report for This Property
The Home Valuation Report is an in-depth analysis detailing your home's value as well as a comparison with similar homes in the area
Home Values in the Area
Average Home Value in this Area
Purchase History
| Date | Buyer | Sale Price | Title Company |
|---|---|---|---|
| Gundrum Anthony John | $92,850 | T A Title Insurance Company |
Source: Public Records
Tax History Compared to Growth
Tax History
| Year | Tax Paid | Tax Assessment Tax Assessment Total Assessment is a certain percentage of the fair market value that is determined by local assessors to be the total taxable value of land and additions on the property. | Land | Improvement |
|---|---|---|---|---|
| 2025 | $3,402 | $86,330 | $35,610 | $50,720 |
| 2024 | $3,402 | $86,330 | $35,610 | $50,720 |
| 2023 | $3,309 | $86,330 | $35,610 | $50,720 |
| 2022 | $3,309 | $86,330 | $35,610 | $50,720 |
| 2021 | $3,195 | $86,330 | $35,610 | $50,720 |
| 2020 | $3,144 | $86,330 | $35,610 | $50,720 |
| 2019 | $3,105 | $86,330 | $35,610 | $50,720 |
| 2018 | $3,106 | $86,330 | $35,610 | $50,720 |
| 2017 | $3,025 | $86,330 | $35,610 | $50,720 |
| 2016 | $2,992 | $86,330 | $35,610 | $50,720 |
| 2015 | $2,913 | $86,330 | $35,610 | $50,720 |
| 2014 | $2,913 | $86,330 | $35,610 | $50,720 |
Source: Public Records
Map
Nearby Homes
- 336 Prospect Ave
- 112 E 4th St
- 407 Holstein St
- 210 Holstein St
- 53 E Front St
- 504 Holstein St
- 823 Coates St
- 13 Ford St Unit A
- 13 Ford St Unit B
- 19 E Front St
- 7 Ford St Unit A
- 500 E Rambo St
- 530 Grove St
- 27 Atkins Dr
- 21 Atkins Dr
- 727 Tose St
- 532 Bush St
- 18 Coates St
- 33 Anderson Dr
- Cambridge Plan at River Pointe - Cambridge Townhomes