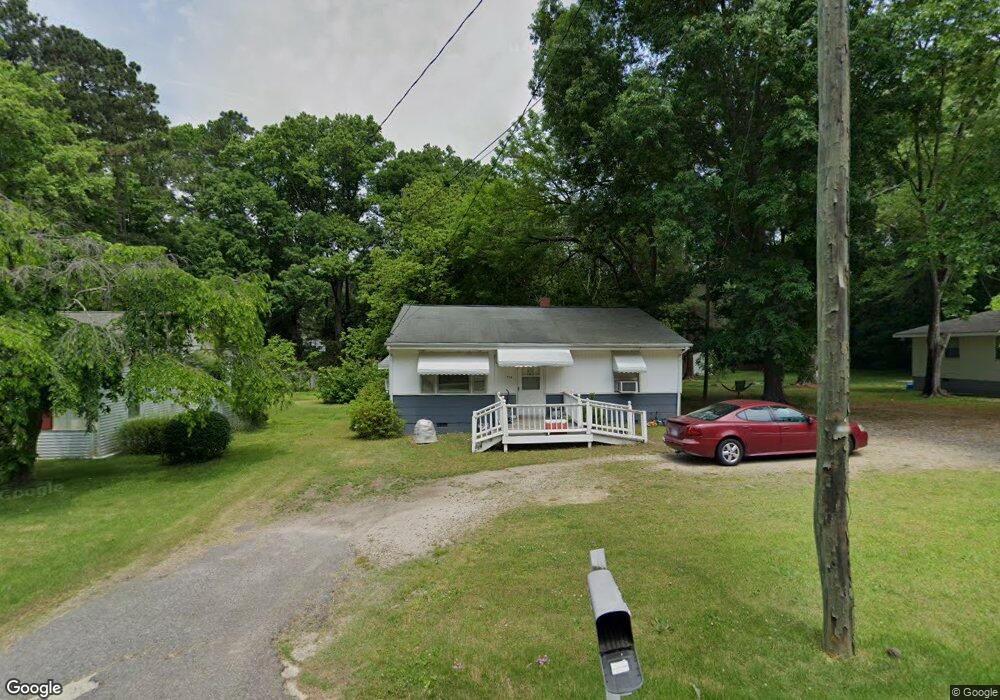
312 Grovemont Rd Raleigh, NC 27603
Estimated Value: $234,000 - $294,000
3
Beds
1
Bath
1,036
Sq Ft
$250/Sq Ft
Est. Value
About This Home
This home is located at 312 Grovemont Rd, Raleigh, NC 27603 and is currently estimated at $258,608, approximately $249 per square foot. 312 Grovemont Rd is a home located in Wake County with nearby schools including Smith Elementary, North Garner Middle, and Garner High.
Ownership History
Date
Name
Owned For
Owner Type
Purchase Details
Closed on
Aug 6, 2025
Sold by
Salek Debbie Martin and Salek David J
Bought by
Greenbrier Bfr Owner Llc
Current Estimated Value
Home Financials for this Owner
Home Financials are based on the most recent Mortgage that was taken out on this home.
Original Mortgage
$21,225,000
Outstanding Balance
$21,206,437
Interest Rate
6.67%
Mortgage Type
Construction
Estimated Equity
-$20,947,829
Purchase Details
Closed on
Dec 30, 2010
Sold by
Martin David J and Evenson Donna Martin
Bought by
Martin David J and Evenson Donna Martin
Purchase Details
Closed on
Sep 5, 2001
Sold by
Keith Josephine M
Bought by
David J Martin Irrevocable Trust
Create a Home Valuation Report for This Property
The Home Valuation Report is an in-depth analysis detailing your home's value as well as a comparison with similar homes in the area
Home Values in the Area
Average Home Value in this Area
Purchase History
| Date | Buyer | Sale Price | Title Company |
|---|---|---|---|
| Greenbrier Bfr Owner Llc | -- | None Listed On Document | |
| Greenbrier Bfr Owner Llc | -- | None Listed On Document | |
| Greenbrier Bfr Owner Llc | $3,775,000 | None Listed On Document | |
| Greenbrier Bfr Owner Llc | $3,775,000 | None Listed On Document | |
| Martin David J | -- | None Available | |
| David J Martin Irrevocable Trust | $86,000 | -- |
Source: Public Records
Mortgage History
| Date | Status | Borrower | Loan Amount |
|---|---|---|---|
| Open | Greenbrier Bfr Owner Llc | $21,225,000 |
Source: Public Records
Tax History Compared to Growth
Tax History
| Year | Tax Paid | Tax Assessment Tax Assessment Total Assessment is a certain percentage of the fair market value that is determined by local assessors to be the total taxable value of land and additions on the property. | Land | Improvement |
|---|---|---|---|---|
| 2025 | -- | $197,772 | $96,000 | $101,772 |
| 2024 | $2,064 | $197,772 | $96,000 | $101,772 |
| 2023 | $1,332 | $102,218 | $38,400 | $63,818 |
| 2022 | $1,218 | $102,218 | $38,400 | $63,818 |
| 2021 | $1,157 | $102,218 | $38,400 | $63,818 |
| 2020 | $1,141 | $102,218 | $38,400 | $63,818 |
| 2019 | $970 | $74,216 | $24,000 | $50,216 |
| 2018 | $901 | $74,216 | $24,000 | $50,216 |
| 2017 | $872 | $74,216 | $24,000 | $50,216 |
| 2016 | $861 | $74,216 | $24,000 | $50,216 |
| 2015 | $1,111 | $96,358 | $40,000 | $56,358 |
| 2014 | $1,059 | $96,358 | $40,000 | $56,358 |
Source: Public Records
Map
Nearby Homes
- 5108 Old Valley St
- 4901 Comelia Dr
- 323 Ranch Farm Rd
- 327 Ranch Farm Rd
- 325 Ranch Farm Rd Unit A / B
- 5107 Overhill St
- 4408 Parkwood Dr
- 721 Grovemont Rd
- 5505 Spring Rd
- 5504 Balsam Place
- 612 Locust Ln
- 1343 Old Buckhorn Rd
- 5515 Spring Rd
- 5716 Spring Rd
- 612 Lakeview Dr
- Lot 32 Bent Pine Place
- 4606 Greenbrier Rd
- 103 Stonecutter Ct
- 104 Forestchase Ct
- 200 Longneedle Ct
- 308 Grovemont Rd
- 314 Grovemont Rd
- 304 Grovemont Rd
- 4913 Cindy Dr
- 309 Grovemont Rd
- 4919 Cindy Dr
- 313 Grovemont Rd
- 300 Grovemont Rd
- 301 Grovemont Rd
- 320 Grovemont Rd
- 321 Grovemont Rd
- 4921 Cindy Dr
- 4918 Cindy Dr
- 325 Grovemont Rd
- 4912 Cindy Dr
- 5001 Cindy Dr
- 329 Grovemont Rd
- 4915 Comelia Dr
- 400 Grovemont Rd
- 5105 Old Valley St