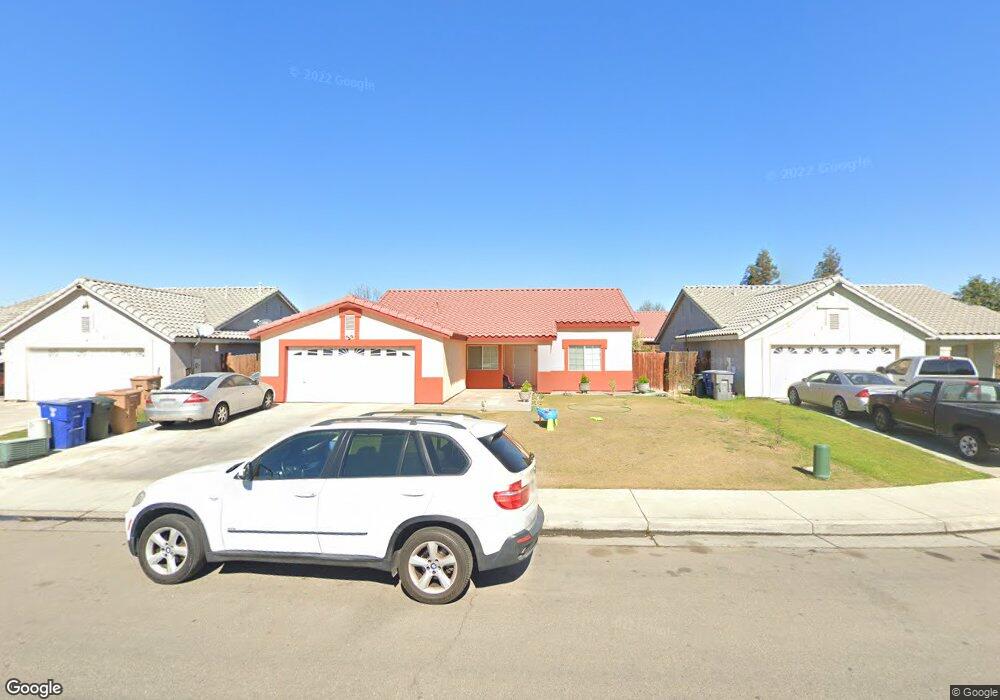
312 Lazy River Ln Bakersfield, CA 93307
Berkshire Farm NeighborhoodEstimated Value: $297,000 - $348,000
4
Beds
2
Baths
1,323
Sq Ft
$243/Sq Ft
Est. Value
About This Home
This home is located at 312 Lazy River Ln, Bakersfield, CA 93307 and is currently estimated at $321,858, approximately $243 per square foot. 312 Lazy River Ln is a home located in Kern County with nearby schools including Valle Verde Elementary School, Leon H. Ollivier Middle School, and Golden Valley High School.
Ownership History
Date
Name
Owned For
Owner Type
Purchase Details
Closed on
Jan 4, 2013
Sold by
Hernandez Barriga Jose and Hernandez De Barriga Maria
Bought by
Hernandez Barriga Jose and Hernandez De Barriga Maria
Current Estimated Value
Home Financials for this Owner
Home Financials are based on the most recent Mortgage that was taken out on this home.
Original Mortgage
$60,000
Interest Rate
3.27%
Mortgage Type
New Conventional
Purchase Details
Closed on
Mar 11, 2008
Sold by
Amezcua Enrique
Bought by
Barriga Jesus and Barriga Maria
Purchase Details
Closed on
Jul 20, 2003
Sold by
Almond Tree Village
Bought by
Barriga Jesus and Barriga Maria
Home Financials for this Owner
Home Financials are based on the most recent Mortgage that was taken out on this home.
Original Mortgage
$110,997
Interest Rate
5.57%
Mortgage Type
FHA
Create a Home Valuation Report for This Property
The Home Valuation Report is an in-depth analysis detailing your home's value as well as a comparison with similar homes in the area
Home Values in the Area
Average Home Value in this Area
Purchase History
| Date | Buyer | Sale Price | Title Company |
|---|---|---|---|
| Hernandez Barriga Jose | -- | Chicago Title Company | |
| Hernandez Barriga Jesus | -- | Chicago Title Company | |
| Barriga Jesus | -- | None Available | |
| Barriga Jesus | $113,000 | First American Title |
Source: Public Records
Mortgage History
| Date | Status | Borrower | Loan Amount |
|---|---|---|---|
| Previous Owner | Hernandez Barriga Jose | $60,000 | |
| Previous Owner | Barriga Jesus | $110,997 |
Source: Public Records
Tax History Compared to Growth
Tax History
| Year | Tax Paid | Tax Assessment Tax Assessment Total Assessment is a certain percentage of the fair market value that is determined by local assessors to be the total taxable value of land and additions on the property. | Land | Improvement |
|---|---|---|---|---|
| 2025 | $2,589 | $166,053 | $52,214 | $113,839 |
| 2024 | $2,527 | $162,798 | $51,191 | $111,607 |
| 2023 | $2,527 | $159,607 | $50,188 | $109,419 |
| 2022 | $2,493 | $156,478 | $49,204 | $107,274 |
| 2021 | $2,374 | $153,411 | $48,240 | $105,171 |
| 2020 | $2,316 | $151,839 | $47,746 | $104,093 |
| 2019 | $2,279 | $151,839 | $47,746 | $104,093 |
| 2018 | $2,190 | $145,944 | $45,893 | $100,051 |
| 2017 | $2,163 | $143,084 | $44,994 | $98,090 |
| 2016 | $2,051 | $140,279 | $44,112 | $96,167 |
| 2015 | $2,024 | $138,173 | $43,450 | $94,723 |
| 2014 | $2,007 | $135,467 | $42,599 | $92,868 |
Source: Public Records
Map
Nearby Homes
- 601 Ginger Snap Ln
- 600 Hosking Ave Unit 10
- 515 Digges Ln
- 7006 Olen Arnold Ave
- 6810 Betty St
- 615 Welch Ave
- 6807 Telford Ct
- 6645 Betty St
- 622 Rushcutters Bay Dr
- 1300 Hadar Rd
- 7803 Quest St Unit 2
- 606 New Zealand Dr
- 7310 Millers Point Ln
- 6717 Tameside Ave
- 1017 Ivy Trae Ln
- 1014 Marmara Ave
- 6709 Tameside Ave
- Residence 4 Plan at Belcourt at Seven Oaks - Amberley
- Residence 1 Plan at Belcourt at Seven Oaks - Amberley
- Residence 3 Plan at Belcourt at Seven Oaks - Amberley
- 308 Lazy River Ln
- 316 Lazy River Ln
- 313 Lake Valley Dr
- 321 Lake Valley Dr
- 304 Lazy River Ln
- 7603 China Doll Ln
- 7600 Elsinore Ave
- 309 Lake Valley Dr
- 402 Lazy River Ln
- 300 Lazy River Ln
- 7611 China Doll Ln
- 403 Lake Valley Dr
- 7604 Elsinore Ave
- 305 Lake Valley Dr
- 7602 China Doll Ln
- 406 Lazy River Ln
- 316 Lake Valley Dr
- 7601 Elsinore Ave
- 7606 China Doll Ln
- 320 Lake Valley Dr