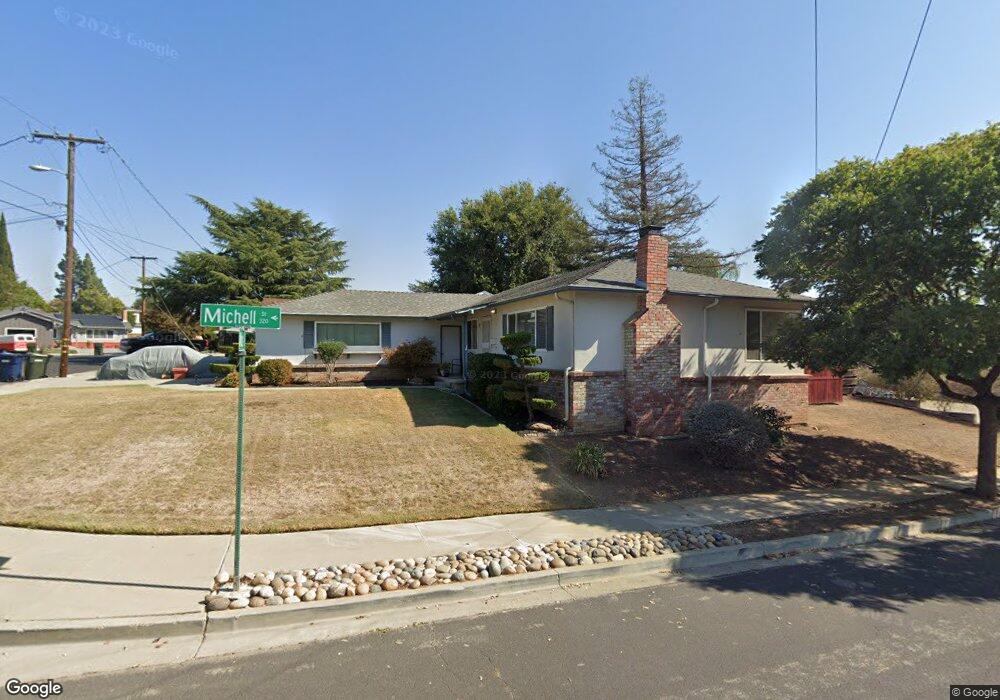
312 Michell Ct Livermore, CA 94551
Portola Glen NeighborhoodEstimated Value: $909,313 - $1,118,000
3
Beds
2
Baths
1,350
Sq Ft
$742/Sq Ft
Est. Value
About This Home
This home is located at 312 Michell Ct, Livermore, CA 94551 and is currently estimated at $1,001,828, approximately $742 per square foot. 312 Michell Ct is a home located in Alameda County with nearby schools including Junction Avenue K-8 School, Livermore High School, and Valley Montessori School.
Ownership History
Date
Name
Owned For
Owner Type
Purchase Details
Closed on
Apr 28, 2017
Sold by
Antony Daiann Tomscak and Tomscak Daiann
Bought by
Revocabl Antony Daiann Tomscak and Revocabl Daiann Tomscak Antony
Current Estimated Value
Purchase Details
Closed on
Jun 11, 2003
Sold by
Mukai Matthew and Mukai Christie
Bought by
Antony David W and Tomscak Daiann
Home Financials for this Owner
Home Financials are based on the most recent Mortgage that was taken out on this home.
Original Mortgage
$319,984
Outstanding Balance
$137,623
Interest Rate
5.53%
Mortgage Type
Purchase Money Mortgage
Estimated Equity
$864,205
Purchase Details
Closed on
May 25, 2000
Sold by
Shestakov Janet E and Shestakov Aleksei I
Bought by
Mukai Matthew and Mukai Christie
Home Financials for this Owner
Home Financials are based on the most recent Mortgage that was taken out on this home.
Original Mortgage
$259,875
Interest Rate
8.18%
Mortgage Type
Stand Alone First
Create a Home Valuation Report for This Property
The Home Valuation Report is an in-depth analysis detailing your home's value as well as a comparison with similar homes in the area
Home Values in the Area
Average Home Value in this Area
Purchase History
| Date | Buyer | Sale Price | Title Company |
|---|---|---|---|
| Revocabl Antony Daiann Tomscak | -- | None Available | |
| Antony David W | $400,000 | New Century Title Company | |
| Mukai Matthew | $297,000 | First California Title Compa | |
| Shestakov Aleksei I | -- | First California Title Compa |
Source: Public Records
Mortgage History
| Date | Status | Borrower | Loan Amount |
|---|---|---|---|
| Open | Antony David W | $319,984 | |
| Previous Owner | Mukai Matthew | $259,875 | |
| Closed | Mukai Matthew | $59,400 | |
| Closed | Antony David W | $59,997 |
Source: Public Records
Tax History
| Year | Tax Paid | Tax Assessment Tax Assessment Total Assessment is a certain percentage of the fair market value that is determined by local assessors to be the total taxable value of land and additions on the property. | Land | Improvement |
|---|---|---|---|---|
| 2025 | $7,512 | $572,135 | $173,784 | $405,351 |
| 2024 | $7,512 | $560,781 | $170,377 | $397,404 |
| 2023 | $7,395 | $556,652 | $167,037 | $389,615 |
| 2022 | $7,283 | $538,738 | $163,762 | $381,976 |
| 2021 | $6,389 | $528,041 | $160,552 | $374,489 |
| 2020 | $6,921 | $529,558 | $158,907 | $370,651 |
| 2019 | $6,946 | $519,177 | $155,792 | $363,385 |
| 2018 | $6,793 | $509,000 | $152,738 | $356,262 |
| 2017 | $6,616 | $499,022 | $149,744 | $349,278 |
| 2016 | $6,448 | $489,241 | $146,809 | $342,432 |
| 2015 | $6,053 | $481,894 | $144,604 | $337,290 |
| 2014 | $5,948 | $472,457 | $141,772 | $330,685 |
Source: Public Records
Map
Nearby Homes
- 3370 Gardella Plaza
- 112 Martin Ave
- 3473 Edinburgh Dr
- 2840 Salt Pond Common
- 2840 Waverley Way
- 3873 Inverness Common
- 984 Waverly Common
- 3959 Purdue Way
- 2155 Chestnut St
- 4128 Camrose Ave
- 350 N K St
- 0 N K St
- 317 Hillcrest Ave
- 3992 Yale Way
- 865 Bower Ct
- 2235 4th St
- 3910 East Ave
- 560 N M St
- 1861 Linden St
- 157 Zephyr Place Unit 109
- 314 Michell Ct
- 306 Michell St
- 315 Michell St
- 309 Michell St
- 320 Michell Ct
- 321 Michell St
- 332 Michell Ct
- 330 Michell Ct
- 292 Michell St
- 322 Michell Ct
- 333 Michell St
- 3370 Gardella Plaza Unit Room 2
- 3370 Gardella Plaza Unit Room 4
- 3370 Gardella Plaza Unit Room 3
- 3370 Gardella Plaza Unit Room 7
- 328 Michell Ct
- 326 Michell Ct
- 286 Michell St
- 322 Martin Ave
- 318 Martin Ave
Your Personal Tour Guide
Ask me questions while you tour the home.