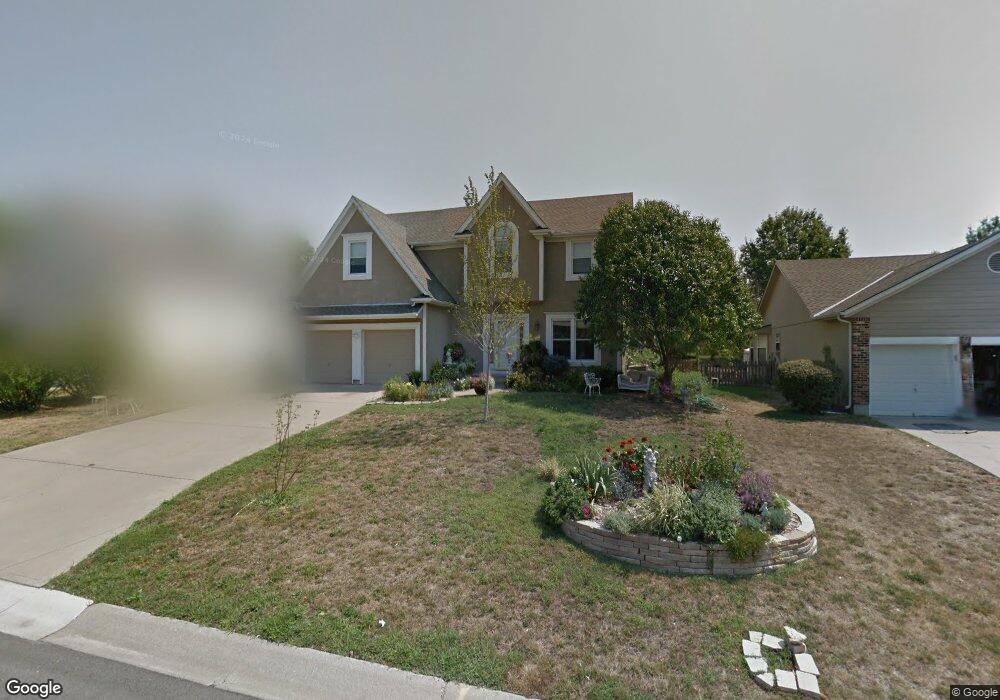
312 Sandra Ln Belton, MO 64012
Estimated Value: $338,000 - $433,000
4
Beds
3
Baths
2,398
Sq Ft
$154/Sq Ft
Est. Value
About This Home
This home is located at 312 Sandra Ln, Belton, MO 64012 and is currently estimated at $370,142, approximately $154 per square foot. 312 Sandra Ln is a home located in Cass County with nearby schools including Gladden Elementary School, Mill Creek Upper Elementary School, and Belton Middle School.
Ownership History
Date
Name
Owned For
Owner Type
Purchase Details
Closed on
Sep 9, 2011
Sold by
The Bank Of New York Mellon
Bought by
Dixon David A and Dixon Debra J
Current Estimated Value
Home Financials for this Owner
Home Financials are based on the most recent Mortgage that was taken out on this home.
Original Mortgage
$90,000
Interest Rate
3.99%
Mortgage Type
New Conventional
Purchase Details
Closed on
Jun 22, 2006
Sold by
Hyden Hank B and Glenn Susan Janette
Bought by
Tarry Brian A and Tarry Andrea J
Home Financials for this Owner
Home Financials are based on the most recent Mortgage that was taken out on this home.
Original Mortgage
$160,000
Interest Rate
6.56%
Mortgage Type
New Conventional
Create a Home Valuation Report for This Property
The Home Valuation Report is an in-depth analysis detailing your home's value as well as a comparison with similar homes in the area
Home Values in the Area
Average Home Value in this Area
Purchase History
| Date | Buyer | Sale Price | Title Company |
|---|---|---|---|
| Dixon David A | -- | None Available | |
| Tarry Brian A | -- | -- |
Source: Public Records
Mortgage History
| Date | Status | Borrower | Loan Amount |
|---|---|---|---|
| Previous Owner | Dixon David A | $90,000 | |
| Previous Owner | Tarry Brian A | $160,000 |
Source: Public Records
Tax History
| Year | Tax Paid | Tax Assessment Tax Assessment Total Assessment is a certain percentage of the fair market value that is determined by local assessors to be the total taxable value of land and additions on the property. | Land | Improvement |
|---|---|---|---|---|
| 2025 | $3,649 | $49,940 | $3,440 | $46,500 |
| 2024 | $3,649 | $44,260 | $3,130 | $41,130 |
| 2023 | $3,640 | $44,260 | $3,130 | $41,130 |
| 2022 | $3,286 | $39,600 | $3,130 | $36,470 |
| 2021 | $3,286 | $39,600 | $3,130 | $36,470 |
| 2020 | $3,171 | $37,990 | $3,130 | $34,860 |
| 2019 | $3,105 | $37,990 | $3,130 | $34,860 |
| 2018 | $2,746 | $33,880 | $2,500 | $31,380 |
| 2017 | $2,641 | $33,880 | $2,500 | $31,380 |
| 2016 | $2,641 | $32,400 | $2,500 | $29,900 |
| 2015 | $2,640 | $32,400 | $2,500 | $29,900 |
| 2014 | $2,649 | $32,400 | $2,500 | $29,900 |
| 2013 | -- | $32,400 | $2,500 | $29,900 |
Source: Public Records
Map
Nearby Homes
Your Personal Tour Guide
Ask me questions while you tour the home.