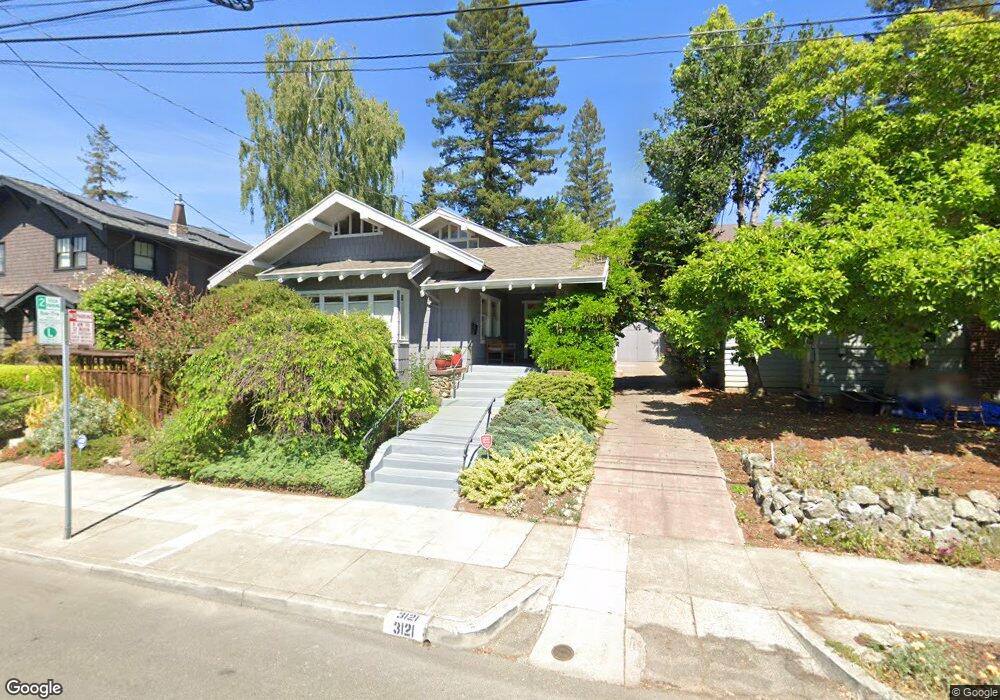
3121 Lewiston Ave Berkeley, CA 94705
Elmwood NeighborhoodEstimated Value: $2,039,000 - $2,336,000
3
Beds
2
Baths
1,782
Sq Ft
$1,242/Sq Ft
Est. Value
About This Home
This home is located at 3121 Lewiston Ave, Berkeley, CA 94705 and is currently estimated at $2,212,994, approximately $1,241 per square foot. 3121 Lewiston Ave is a home located in Alameda County with nearby schools including John Muir Elementary School, Emerson Elementary School, and Malcolm X Elementary School.
Ownership History
Date
Name
Owned For
Owner Type
Purchase Details
Closed on
Feb 15, 2020
Sold by
Brazil Wayne D and Byrnes Rebecca
Bought by
Brazil Wayne D and Byrnes Rebecca
Current Estimated Value
Home Financials for this Owner
Home Financials are based on the most recent Mortgage that was taken out on this home.
Original Mortgage
$1,015,200
Outstanding Balance
$898,889
Interest Rate
3.6%
Mortgage Type
New Conventional
Estimated Equity
$1,314,105
Purchase Details
Closed on
Aug 30, 2016
Sold by
Brazil Wayne D and Byrnes Barbara Rebecca
Bought by
Brazil Wayne D and Byrnes Rebecca
Purchase Details
Closed on
Jun 26, 2015
Sold by
Connor Allison Ann
Bought by
Brazil Wayne D and Byrnes Barbara Rebecca
Home Financials for this Owner
Home Financials are based on the most recent Mortgage that was taken out on this home.
Original Mortgage
$1,100,000
Interest Rate
3.81%
Mortgage Type
New Conventional
Purchase Details
Closed on
Oct 10, 1993
Sold by
Connor Ann Wilkinson
Bought by
Connor Ann Olivia Wilkinson
Create a Home Valuation Report for This Property
The Home Valuation Report is an in-depth analysis detailing your home's value as well as a comparison with similar homes in the area
Home Values in the Area
Average Home Value in this Area
Purchase History
| Date | Buyer | Sale Price | Title Company |
|---|---|---|---|
| Brazil Wayne D | -- | Amrock Inc | |
| Brazil Wayne D | -- | Amrock Inc | |
| Brazil Wayne D | -- | None Available | |
| Brazil Wayne D | $1,650,000 | Old Republic Title Company | |
| Connor Ann Olivia Wilkinson | -- | -- |
Source: Public Records
Mortgage History
| Date | Status | Borrower | Loan Amount |
|---|---|---|---|
| Open | Brazil Wayne D | $1,015,200 | |
| Closed | Brazil Wayne D | $1,100,000 |
Source: Public Records
Tax History Compared to Growth
Tax History
| Year | Tax Paid | Tax Assessment Tax Assessment Total Assessment is a certain percentage of the fair market value that is determined by local assessors to be the total taxable value of land and additions on the property. | Land | Improvement |
|---|---|---|---|---|
| 2025 | $28,360 | $1,967,868 | $591,885 | $1,382,983 |
| 2024 | $28,360 | $1,929,148 | $580,280 | $1,355,868 |
| 2023 | $27,753 | $1,898,194 | $568,905 | $1,329,289 |
| 2022 | $27,479 | $1,853,975 | $557,750 | $1,303,225 |
| 2021 | $27,340 | $1,797,489 | $546,815 | $1,257,674 |
| 2020 | $26,064 | $1,785,993 | $541,210 | $1,244,783 |
| 2019 | $25,236 | $1,750,980 | $530,600 | $1,220,380 |
| 2018 | $24,830 | $1,716,660 | $520,200 | $1,196,460 |
| 2017 | $24,013 | $1,683,000 | $510,000 | $1,173,000 |
| 2016 | $23,356 | $1,650,000 | $500,000 | $1,150,000 |
| 2015 | $8,438 | $429,381 | $128,814 | $300,567 |
| 2014 | $8,316 | $420,971 | $126,291 | $294,680 |
Source: Public Records
Map
Nearby Homes
- 2477 Prince St
- 2951 Linden Ave
- 6446 Colby St
- 5687 Miles Ave
- 204 El Camino Real
- 5936 Broadway
- 2243 Ashby Ave
- 2702 Dana St
- 2611 Piedmont Ave Unit 4
- 1488 Alvarado Rd
- 2732 Parker St
- 669 Alcatraz Ave
- 5765 Manila Ave
- 2110 Ashby Ave
- 6320 Shattuck Ave
- 0 Tunnel Rd
- 6555 Shattuck Ave
- 3050 Shattuck Ave
- 2543 Chilton Way
- 260 Alvarado Rd
- 3125 Lewiston Ave
- 3117 Lewiston Ave
- 3120 Eton Ave
- 3122 Eton Ave
- 3129 Lewiston Ave
- 3115 Lewiston Ave
- 3114 Eton Ave
- 3124 Eton Ave
- 3133 Lewiston Ave
- 3109 Lewiston Ave
- 3120 Lewiston Ave
- 3126 Eton Ave
- 3116 Lewiston Ave
- 3124 Lewiston Ave
- 3112 Lewiston Ave
- 3130 Lewiston Ave
- 3139 Lewiston Ave
- 3107 Lewiston Ave
- 3130 Eton Ave Unit A
- 3130 Eton Ave