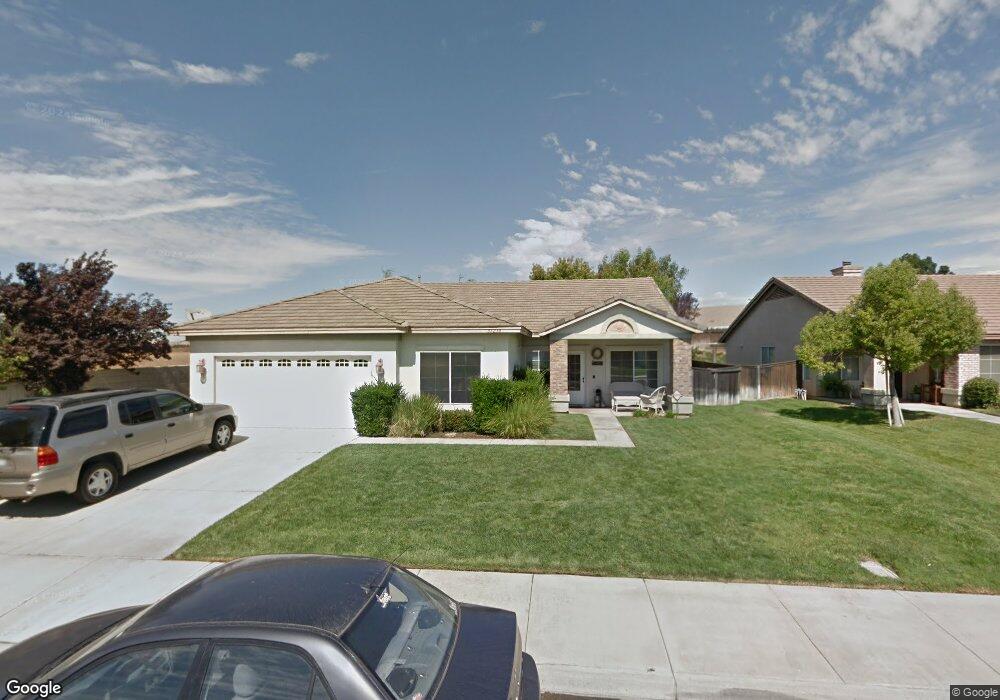
31210 Van Eyck Ct Winchester, CA 92596
Estimated Value: $614,000 - $651,000
4
Beds
2
Baths
2,030
Sq Ft
$312/Sq Ft
Est. Value
About This Home
This home is located at 31210 Van Eyck Ct, Winchester, CA 92596 and is currently estimated at $633,453, approximately $312 per square foot. 31210 Van Eyck Ct is a home located in Riverside County with nearby schools including Susan La Vorgna Elementary School, Bella Vista Middle School, and Chaparral High School.
Ownership History
Date
Name
Owned For
Owner Type
Purchase Details
Closed on
Sep 27, 2004
Sold by
Stuck Nancy
Bought by
Stuck Nancy
Current Estimated Value
Home Financials for this Owner
Home Financials are based on the most recent Mortgage that was taken out on this home.
Original Mortgage
$215,000
Outstanding Balance
$106,407
Interest Rate
5.76%
Mortgage Type
Stand Alone Refi Refinance Of Original Loan
Estimated Equity
$527,046
Purchase Details
Closed on
Jan 21, 2004
Sold by
Stuck Joseph and Stuck Nancy
Bought by
Stuck Nancy
Purchase Details
Closed on
Dec 29, 1998
Sold by
The Forecast Group Lp
Bought by
Stuck Joseph and Stuck Nancy
Home Financials for this Owner
Home Financials are based on the most recent Mortgage that was taken out on this home.
Original Mortgage
$166,750
Interest Rate
6.63%
Mortgage Type
VA
Create a Home Valuation Report for This Property
The Home Valuation Report is an in-depth analysis detailing your home's value as well as a comparison with similar homes in the area
Home Values in the Area
Average Home Value in this Area
Purchase History
| Date | Buyer | Sale Price | Title Company |
|---|---|---|---|
| Stuck Nancy | -- | Stewart Title Riverside | |
| Stuck Nancy | -- | -- | |
| Stuck Joseph | $162,000 | First American Title Co |
Source: Public Records
Mortgage History
| Date | Status | Borrower | Loan Amount |
|---|---|---|---|
| Open | Stuck Nancy | $215,000 | |
| Closed | Stuck Joseph | $166,750 |
Source: Public Records
Tax History
| Year | Tax Paid | Tax Assessment Tax Assessment Total Assessment is a certain percentage of the fair market value that is determined by local assessors to be the total taxable value of land and additions on the property. | Land | Improvement |
|---|---|---|---|---|
| 2025 | $2,781 | $277,239 | $54,854 | $222,385 |
| 2023 | $2,781 | $266,475 | $52,725 | $213,750 |
| 2022 | $2,702 | $261,251 | $51,692 | $209,559 |
| 2021 | $2,649 | $256,129 | $50,679 | $205,450 |
| 2020 | $2,622 | $253,504 | $50,160 | $203,344 |
| 2019 | $2,583 | $248,534 | $49,177 | $199,357 |
| 2018 | $2,535 | $243,662 | $48,213 | $195,449 |
| 2017 | $2,490 | $238,885 | $47,268 | $191,617 |
| 2016 | $2,438 | $234,202 | $46,342 | $187,860 |
| 2015 | $5,169 | $230,686 | $45,647 | $185,039 |
| 2014 | $5,097 | $226,168 | $44,753 | $181,415 |
Source: Public Records
Map
Nearby Homes
- 31238 Jan Steen Ct
- 36143 Tahoe St
- 35602 Driftwood St
- 30873 Bald Eagle St
- 35628 Hawkeye St
- 31522 Amsterdam Rd
- 31659 Poppy St
- 35622 Denver Cir
- 36171 Joltaire Way
- 36377 Capri Dr
- 35831 Bobcat Way
- 36562 Van Gaale Ln
- 35430 Marabella Ct
- 35781 Bobcat Way
- 31832 Granville Dr
- 35390 Marabella Ct
- 35385 Summerholly Ln
- 31856 Granville Dr
- 31277 Ermitage Ln
- 31692 Pompei Ln
- 31224 Van Eyck Ct
- 31238 Van Eyck Ct
- 31237 Frans Hals Dr
- 31202 Jan Steen Ct
- 31207 Van Eyck Ct
- 31221 Van Eyck Ct
- 31251 Frans Hals Dr
- 31252 Van Eyck Ct
- 31235 Van Eyck Ct
- 31214 Jan Steen Ct
- 31265 Frans Hals Dr
- 31249 Van Eyck Ct
- 31266 Van Eyck Ct
- 31226 Jan Steen Ct
- 31263 Van Eyck Ct
- 31279 Frans Hals Dr
- 31280 Van Eyck Ct
- 31254 Frans Hals Dr
- 31277 Van Eyck Ct
- 31293 Frans Hals Dr
Your Personal Tour Guide
Ask me questions while you tour the home.