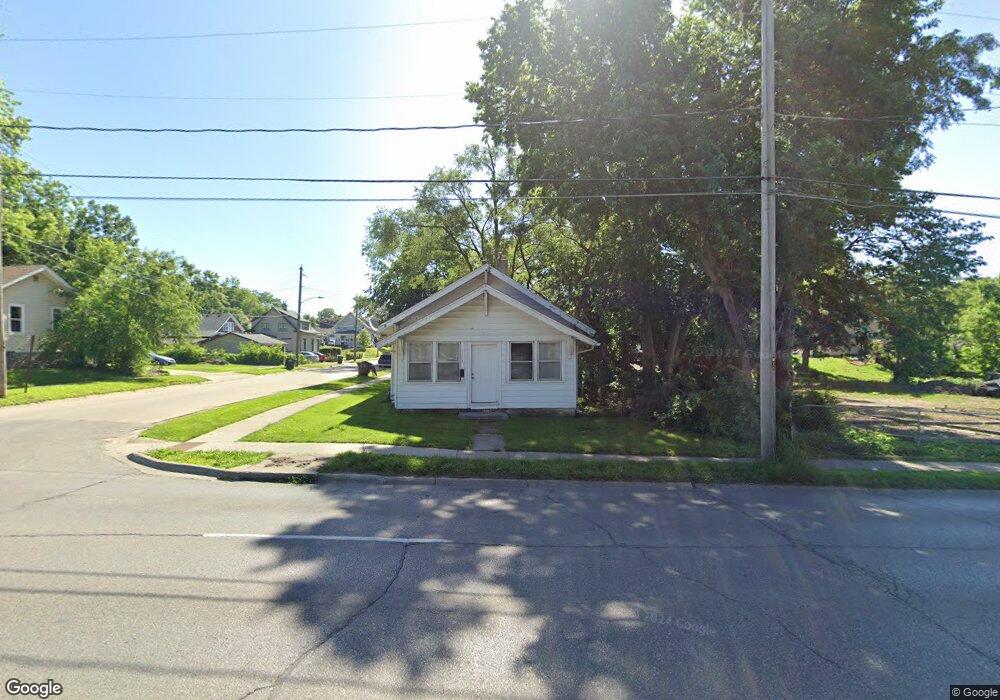
3123 2nd Ave Des Moines, IA 50313
Highland Park NeighborhoodEstimated Value: $118,000 - $144,000
2
Beds
1
Bath
874
Sq Ft
$155/Sq Ft
Est. Value
About This Home
This home is located at 3123 2nd Ave, Des Moines, IA 50313 and is currently estimated at $135,333, approximately $154 per square foot. 3123 2nd Ave is a home located in Polk County with nearby schools including Findley Elementary School, Harding Middle School, and North High School.
Ownership History
Date
Name
Owned For
Owner Type
Purchase Details
Closed on
Mar 1, 2021
Sold by
Barry Michelle E
Bought by
Prairie Nest Llc
Current Estimated Value
Home Financials for this Owner
Home Financials are based on the most recent Mortgage that was taken out on this home.
Original Mortgage
$400,000
Outstanding Balance
$357,756
Interest Rate
2.7%
Mortgage Type
Future Advance Clause Open End Mortgage
Estimated Equity
-$222,423
Purchase Details
Closed on
Mar 22, 2001
Sold by
Carmichael Shawn P
Bought by
The Associates Financial Services Co
Create a Home Valuation Report for This Property
The Home Valuation Report is an in-depth analysis detailing your home's value as well as a comparison with similar homes in the area
Home Values in the Area
Average Home Value in this Area
Purchase History
| Date | Buyer | Sale Price | Title Company |
|---|---|---|---|
| Prairie Nest Llc | -- | None Available | |
| The Associates Financial Services Co | -- | -- |
Source: Public Records
Mortgage History
| Date | Status | Borrower | Loan Amount |
|---|---|---|---|
| Open | Prairie Nest Llc | $400,000 |
Source: Public Records
Tax History Compared to Growth
Tax History
| Year | Tax Paid | Tax Assessment Tax Assessment Total Assessment is a certain percentage of the fair market value that is determined by local assessors to be the total taxable value of land and additions on the property. | Land | Improvement |
|---|---|---|---|---|
| 2025 | $1,836 | $107,600 | $26,300 | $81,300 |
| 2024 | $1,836 | $93,300 | $22,800 | $70,500 |
| 2023 | $1,720 | $93,300 | $22,800 | $70,500 |
| 2022 | $1,708 | $73,000 | $18,200 | $54,800 |
| 2021 | $1,594 | $73,000 | $18,200 | $54,800 |
| 2020 | $1,656 | $63,900 | $16,100 | $47,800 |
| 2019 | $1,538 | $63,900 | $16,100 | $47,800 |
| 2018 | $1,522 | $57,200 | $14,200 | $43,000 |
| 2017 | $1,418 | $57,200 | $14,200 | $43,000 |
| 2016 | $1,380 | $52,400 | $13,000 | $39,400 |
| 2015 | $1,380 | $52,400 | $13,000 | $39,400 |
| 2014 | $1,328 | $51,900 | $12,700 | $39,200 |
Source: Public Records
Map
Nearby Homes