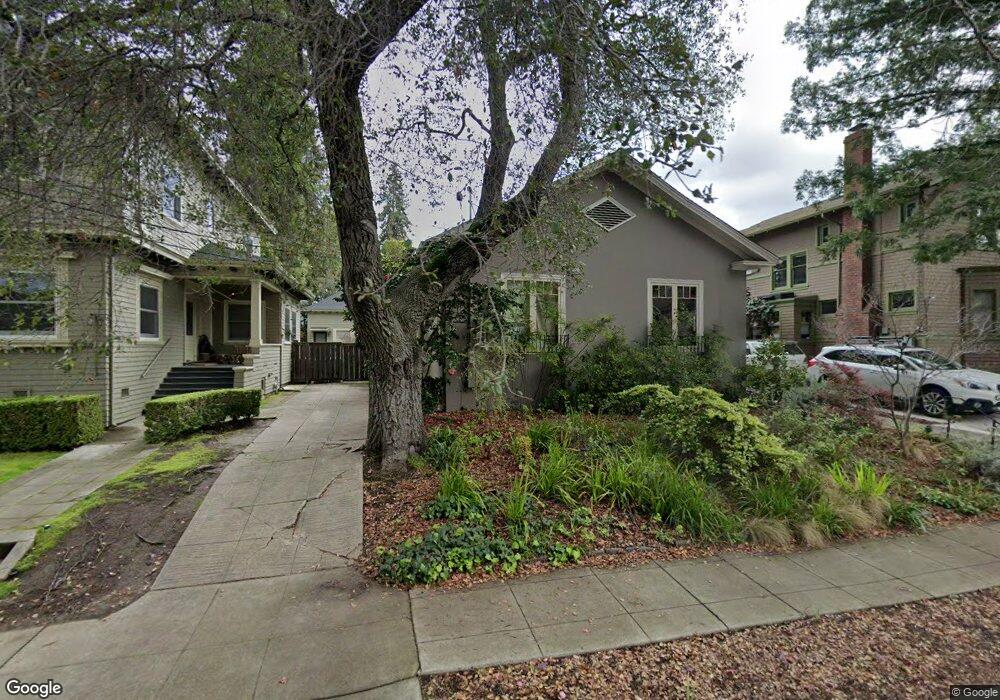
3123 Eton Ave Berkeley, CA 94705
Elmwood NeighborhoodEstimated Value: $2,193,893 - $2,669,000
2
Beds
2
Baths
2,078
Sq Ft
$1,185/Sq Ft
Est. Value
About This Home
This home is located at 3123 Eton Ave, Berkeley, CA 94705 and is currently estimated at $2,461,723, approximately $1,184 per square foot. 3123 Eton Ave is a home located in Alameda County with nearby schools including John Muir Elementary School, Emerson Elementary School, and Malcolm X Elementary School.
Ownership History
Date
Name
Owned For
Owner Type
Purchase Details
Closed on
Dec 15, 2016
Sold by
Riegels Nicholas A and Riegels Nardine S
Bought by
Riegels Nardine and Riegels Nicholas
Current Estimated Value
Purchase Details
Closed on
Nov 8, 2013
Sold by
Brownrigg S A
Bought by
Riegels Nicholas A and Riegels Nardine
Home Financials for this Owner
Home Financials are based on the most recent Mortgage that was taken out on this home.
Original Mortgage
$1,000,000
Outstanding Balance
$744,268
Interest Rate
4.18%
Mortgage Type
New Conventional
Estimated Equity
$1,717,455
Purchase Details
Closed on
Jul 25, 2011
Sold by
Thomson Sedge
Bought by
Brownrigg S A
Purchase Details
Closed on
Jul 22, 2011
Sold by
Ratcliff Katherine S and Katherine H Schneck Living Tru
Bought by
Brownrigg S A
Purchase Details
Closed on
Feb 4, 1998
Sold by
Schenck Katherine H
Bought by
Schenck Katherine H and The Katherine H Schenck Living
Create a Home Valuation Report for This Property
The Home Valuation Report is an in-depth analysis detailing your home's value as well as a comparison with similar homes in the area
Home Values in the Area
Average Home Value in this Area
Purchase History
| Date | Buyer | Sale Price | Title Company |
|---|---|---|---|
| Riegels Nardine | -- | None Available | |
| Riegels Nicholas A | $1,325,000 | Chicago Title Company | |
| Brownrigg S A | -- | Old Republic Title Company M | |
| Brownrigg S A | $1,025,000 | Old Republic Title Company M | |
| Schenck Katherine H | -- | -- |
Source: Public Records
Mortgage History
| Date | Status | Borrower | Loan Amount |
|---|---|---|---|
| Open | Riegels Nicholas A | $1,000,000 |
Source: Public Records
Tax History
| Year | Tax Paid | Tax Assessment Tax Assessment Total Assessment is a certain percentage of the fair market value that is determined by local assessors to be the total taxable value of land and additions on the property. | Land | Improvement |
|---|---|---|---|---|
| 2025 | $23,389 | $1,639,689 | $487,259 | $1,159,430 |
| 2024 | $23,389 | $1,607,408 | $477,707 | $1,136,701 |
| 2023 | $22,921 | $1,582,759 | $468,342 | $1,114,417 |
| 2022 | $22,551 | $1,544,728 | $459,160 | $1,092,568 |
| 2021 | $22,632 | $1,514,314 | $450,160 | $1,071,154 |
| 2020 | $21,515 | $1,505,717 | $445,545 | $1,060,172 |
| 2019 | $20,777 | $1,476,204 | $436,812 | $1,039,392 |
| 2018 | $20,454 | $1,447,269 | $428,250 | $1,019,019 |
| 2017 | $19,778 | $1,418,897 | $419,855 | $999,042 |
| 2016 | $19,297 | $1,391,077 | $411,623 | $979,454 |
| 2015 | $18,766 | $1,351,473 | $405,442 | $946,031 |
| 2014 | $18,618 | $1,325,000 | $397,500 | $927,500 |
Source: Public Records
Map
Nearby Homes
- 2800 Prince St
- 2962 Piedmont Ave
- 360 Alcatraz Ave
- 2477 Prince St
- 6446 Colby St
- 6100 Chabot Rd
- 5910 Chabot Rd
- 2935 Florence St
- 6189 Margarido Dr
- 5936 Broadway
- 2817 Palm Ct
- 204 El Camino Real
- 2643 Stuart St
- 2917 Telegraph Ave
- 3046 Deakin St
- 2243 Ashby Ave
- 5466 Shafter Ave
- 5883 Margarido Dr
- 1488 Alvarado Rd
- 5499 Claremont Ave
- 3119 Eton Ave
- 3127 Eton Ave
- 156 Brookside Dr
- 3131 Eton Ave
- 3115 Eton Ave Unit A
- 3115 Eton Ave Unit B
- 158 Brookside Dr
- 154 Brookside Dr
- 160 Brookside Dr
- 3111 Eton Ave Unit 4
- 3111 Eton Ave Unit 3
- 3111 Eton Ave Unit 2
- 3111 Eton Ave Unit 1
- 3122 Eton Ave
- 3120 Eton Ave
- 152 Brookside Dr
- 170 Brookside Dr
- 3124 Eton Ave
- 3114 Eton Ave
- 3139 Eton Ave
Your Personal Tour Guide
Ask me questions while you tour the home.