3124 Taransay Rd Unit 11 Memphis, TN 38128
Frayser NeighborhoodEstimated Value: $70,000 - $86,000
3
Beds
2
Baths
1,654
Sq Ft
$46/Sq Ft
Est. Value
About This Home
This home is located at 3124 Taransay Rd Unit 11, Memphis, TN 38128 and is currently estimated at $76,157, approximately $46 per square foot. 3124 Taransay Rd Unit 11 is a home located in Shelby County with nearby schools including Scenic Hills Elementary School, Raleigh Egypt High School, and Promise Academy - Spring Hill.
Ownership History
Date
Name
Owned For
Owner Type
Purchase Details
Closed on
May 31, 2022
Sold by
Sherece Redick
Bought by
Bright Door Property Llc
Current Estimated Value
Home Financials for this Owner
Home Financials are based on the most recent Mortgage that was taken out on this home.
Original Mortgage
$60,450
Outstanding Balance
$57,433
Interest Rate
5.1%
Mortgage Type
New Conventional
Estimated Equity
$18,725
Purchase Details
Closed on
May 1, 2013
Sold by
Donovan Shaun
Bought by
Redick Sherece
Purchase Details
Closed on
Feb 13, 2013
Sold by
Washington Carolyn H and Washington Lyndon
Bought by
Secretary Of Hud
Purchase Details
Closed on
Aug 16, 2000
Sold by
Washington Lyndon R
Bought by
Washington Carolyn Felicia
Purchase Details
Closed on
Dec 22, 1995
Bought by
Miller Archie S and Miller M S
Create a Home Valuation Report for This Property
The Home Valuation Report is an in-depth analysis detailing your home's value as well as a comparison with similar homes in the area
Home Values in the Area
Average Home Value in this Area
Purchase History
| Date | Buyer | Sale Price | Title Company |
|---|---|---|---|
| Bright Door Property Llc | $10,475 | Boston National Title Agency | |
| Redick Sherece | $12,500 | None Available | |
| Secretary Of Hud | $51,006 | None Available | |
| Washington Carolyn Felicia | -- | -- | |
| Miller Archie S | $49,900 | -- |
Source: Public Records
Mortgage History
| Date | Status | Borrower | Loan Amount |
|---|---|---|---|
| Open | Bright Door Property Llc | $60,450 |
Source: Public Records
Tax History Compared to Growth
Tax History
| Year | Tax Paid | Tax Assessment Tax Assessment Total Assessment is a certain percentage of the fair market value that is determined by local assessors to be the total taxable value of land and additions on the property. | Land | Improvement |
|---|---|---|---|---|
| 2025 | $355 | $28,080 | $2,560 | $25,520 |
| 2024 | $355 | $10,475 | $1,600 | $8,875 |
| 2023 | $638 | $10,475 | $1,600 | $8,875 |
| 2022 | $638 | $10,475 | $1,600 | $8,875 |
| 2021 | $758 | $10,475 | $1,600 | $8,875 |
| 2020 | $706 | $9,750 | $1,600 | $8,150 |
| 2019 | $312 | $9,750 | $1,600 | $8,150 |
| 2018 | $312 | $9,750 | $1,600 | $8,150 |
| 2017 | $319 | $9,750 | $1,600 | $8,150 |
| 2016 | $453 | $10,375 | $0 | $0 |
| 2014 | $453 | $10,375 | $0 | $0 |
Source: Public Records
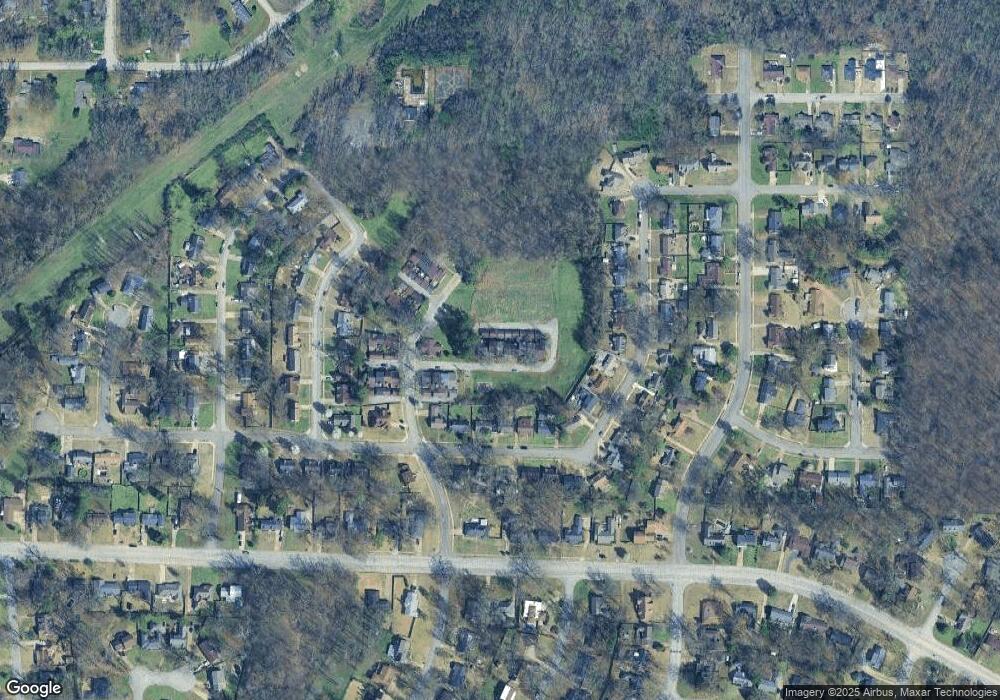
Map
Nearby Homes
- 3090 Taransay Rd Unit 20
- 3046 Carnoustie Cove
- 3021 Whitney Ave
- 3243 Dumbeath Cove
- 3228 Whitney Ave
- 3034 Bannockburn Rd
- 2976 Scotland Rd
- 3095 Spring Hill Dr
- 2995 Frayser-Raleigh Rd
- 2958 E Glengarry Rd
- 3121 S Glengarry Rd
- 3371 Emmons Dr
- 3356 William Tell Dr
- 0 Allen Rd Unit 10207133
- 2793 Frayser Blvd
- 3457 E Rolling Woods Dr
- 2714 Nix Cove
- 2701 Frayser Blvd
- 2593 Sandpiper Ave
- 3005 Frayser-Raleigh Rd
- 3124 Taransay Rd
- 3126 Taransay Rd Unit 12
- 3122 Taransay Rd Unit 10
- 3120 Taransay Rd Unit 9
- 3128 Taransay Rd Unit 13
- 3132 Taransay Rd Unit 14
- 3109 Taransay Rd Unit 3103
- 3109 Taransay Rd Unit 8
- 3134 Taransay Rd Unit 15
- 3107 Taransay Rd Unit 7
- 3138 Taransay Rd Unit 16
- 3103 Taransay Rd Unit 6
- 3101 Taransay Rd Unit 5
- 3099 Castlebay Rd Unit 25
- 3100 Castlebay Rd Unit 24
- 0 Taransay Rd
- 3095 Castlebay Rd Unit 24
- 3120 Dumbeath Rd
- 3112 Dumbeath Rd
- 3126 Dumbeath Rd