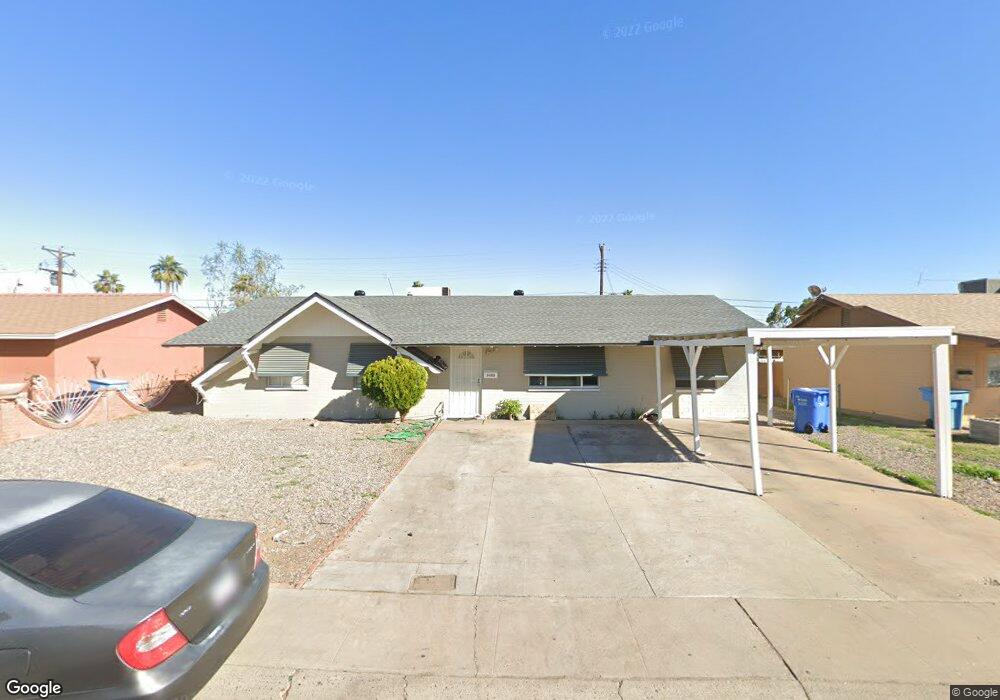
3125 N 43rd Dr Phoenix, AZ 85031
Maryvale NeighborhoodEstimated Value: $284,417 - $360,000
3
Beds
2
Baths
1,305
Sq Ft
$253/Sq Ft
Est. Value
About This Home
This home is located at 3125 N 43rd Dr, Phoenix, AZ 85031 and is currently estimated at $329,854, approximately $252 per square foot. 3125 N 43rd Dr is a home located in Maricopa County with nearby schools including Justine Spitalny School, Marc T. Atkinson Middle School, and Maryvale High School.
Ownership History
Date
Name
Owned For
Owner Type
Purchase Details
Closed on
Dec 7, 2009
Sold by
Gagliano Frank
Bought by
3125 N 43 Dr Llc
Current Estimated Value
Purchase Details
Closed on
Jul 15, 2008
Sold by
Deutsche Bank National Trust
Bought by
Gagliano Frank
Purchase Details
Closed on
Jan 10, 2008
Sold by
Martinez Luis Miranda and Sicaeros Jesus
Bought by
Deutsche Bank National Trust Co and Soundview Home Loan Trust
Purchase Details
Closed on
Oct 22, 1997
Sold by
Sicairos Lidia
Bought by
Martinez Luis Miranda
Home Financials for this Owner
Home Financials are based on the most recent Mortgage that was taken out on this home.
Original Mortgage
$68,712
Interest Rate
7.23%
Mortgage Type
FHA
Purchase Details
Closed on
May 6, 1982
Sold by
Jim Custer Realty Inc
Bought by
Everhart Kathy A
Create a Home Valuation Report for This Property
The Home Valuation Report is an in-depth analysis detailing your home's value as well as a comparison with similar homes in the area
Home Values in the Area
Average Home Value in this Area
Purchase History
| Date | Buyer | Sale Price | Title Company |
|---|---|---|---|
| 3125 N 43 Dr Llc | $113,000 | None Available | |
| Gagliano Frank | $65,000 | First American Title Ins Co | |
| Deutsche Bank National Trust Co | $143,650 | Accommodation | |
| Martinez Luis Miranda | -- | Chicago Title Insurance Co | |
| Martinez Luis Miranda | $68,900 | Chicago Title Insurance Co | |
| Everhart Kathy A | -- | Chicago Title Insurance Co |
Source: Public Records
Mortgage History
| Date | Status | Borrower | Loan Amount |
|---|---|---|---|
| Previous Owner | Martinez Luis Miranda | $68,712 |
Source: Public Records
Tax History Compared to Growth
Tax History
| Year | Tax Paid | Tax Assessment Tax Assessment Total Assessment is a certain percentage of the fair market value that is determined by local assessors to be the total taxable value of land and additions on the property. | Land | Improvement |
|---|---|---|---|---|
| 2025 | $2,030 | $11,598 | -- | -- |
| 2024 | $2,018 | $11,045 | -- | -- |
| 2023 | $2,018 | $22,980 | $4,590 | $18,390 |
| 2022 | $1,903 | $17,300 | $3,460 | $13,840 |
| 2021 | $1,927 | $15,230 | $3,040 | $12,190 |
| 2020 | $1,826 | $13,980 | $2,790 | $11,190 |
| 2019 | $1,747 | $12,020 | $2,400 | $9,620 |
| 2018 | $781 | $10,420 | $2,080 | $8,340 |
| 2017 | $756 | $7,980 | $1,590 | $6,390 |
| 2016 | $723 | $6,670 | $1,330 | $5,340 |
| 2015 | $674 | $5,670 | $1,130 | $4,540 |
Source: Public Records
Map
Nearby Homes
- 4420 W Earll Dr
- 4407 W Monterey Way
- 4315 W Osborn Rd
- 4460 W Avalon Dr
- 3062 N 42nd Ave
- 4338 W Thomas Rd
- 3017 N 46th Dr
- 4502 W Crittenden Ln
- 3020 N 40th Ave
- 2847 N 46th Ave Unit 10
- 2652 N 43rd Ave Unit C
- 2690 N 43rd Ave Unit D
- 2646 N 43rd Ave Unit B
- 2846 N 46th Ave Unit 3
- 2674 N 43rd Ave Unit D
- 2720 N 40th Ave
- 4450 W Weldon Ave
- 4727 W Osborn Rd
- 3840 N 43rd Ave Unit 36
- 3840 N 43rd Ave Unit 58
- 3131 N 43rd Dr
- 3119 N 43rd Dr
- 3126 N 43rd Ave
- 3120 N 43rd Ave
- 3132 N 43rd Ave
- 3113 N 43rd Dr
- 3135 N 43rd Dr
- 3128 N 43rd Dr
- 3122 N 43rd Dr
- 3114 N 43rd Ave
- 3134 N 43rd Dr
- 3138 N 43rd Ave
- 3107 N 43rd Dr
- 3112 N 43rd Dr
- 3201 N 43rd Dr
- 3108 N 43rd Ave
- 4330 W Cheery Lynn Rd
- 3202 N 43rd Ave
- 3108 N 43rd Dr
- 4331 W Monterey Way