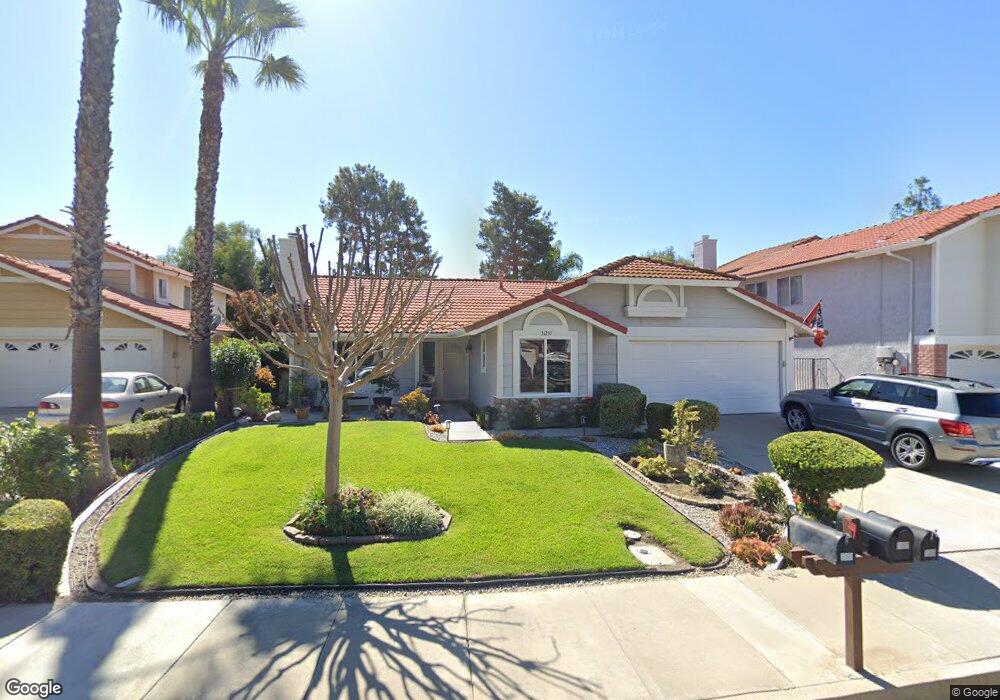
31257 Hiawatha Ct Temecula, CA 92592
Estimated Value: $667,650 - $697,000
4
Beds
2
Baths
1,948
Sq Ft
$351/Sq Ft
Est. Value
About This Home
This home is located at 31257 Hiawatha Ct, Temecula, CA 92592 and is currently estimated at $683,913, approximately $351 per square foot. 31257 Hiawatha Ct is a home located in Riverside County with nearby schools including Temecula Luiseno Elementary, Erle Stanley Gardner Middle School, and Great Oak High School.
Ownership History
Date
Name
Owned For
Owner Type
Purchase Details
Closed on
Dec 11, 2020
Sold by
Cleveland Russell G
Bought by
Cleveland Russell G and The Russell G Cleveland Family
Current Estimated Value
Purchase Details
Closed on
Nov 9, 2001
Sold by
Lucier Peter Francis and Lucier Joan Lois
Bought by
Cleveland Russell G
Home Financials for this Owner
Home Financials are based on the most recent Mortgage that was taken out on this home.
Original Mortgage
$183,550
Outstanding Balance
$69,994
Interest Rate
6.39%
Estimated Equity
$613,919
Purchase Details
Closed on
Apr 24, 2000
Sold by
Lucier Peter Francis and Lucier Joan L
Bought by
Lucier Peter Francis and Lucier Joan Lois
Create a Home Valuation Report for This Property
The Home Valuation Report is an in-depth analysis detailing your home's value as well as a comparison with similar homes in the area
Purchase History
We collect this data history from publicly available records. To have your information removed, we recommend requesting removal directly through your county’s website.
| Date | Buyer | Sale Price | Title Company |
|---|---|---|---|
| Cleveland Russell G | -- | None Available | |
| Cleveland Russell G | $229,500 | Stewart Title | |
| Lucier Peter Francis | -- | -- |
Source: Public Records
Mortgage History
We collect this data history from publicly available records. To have your information removed, we recommend requesting removal directly through your county’s website.
| Date | Status | Borrower | Loan Amount |
|---|---|---|---|
| Open | Cleveland Russell G | $183,550 |
Source: Public Records
Tax History
| Year | Tax Paid | Tax Assessment Tax Assessment Total Assessment is a certain percentage of the fair market value that is determined by local assessors to be the total taxable value of land and additions on the property. | Land | Improvement |
|---|---|---|---|---|
| 2025 | $4,202 | $339,008 | $103,396 | $235,612 |
| 2023 | $4,137 | $325,846 | $99,382 | $226,464 |
| 2022 | $4,002 | $319,458 | $97,434 | $222,024 |
| 2021 | $3,913 | $313,195 | $95,524 | $217,671 |
| 2020 | $3,868 | $309,985 | $94,545 | $215,440 |
| 2019 | $4,670 | $303,908 | $92,692 | $211,216 |
| 2018 | $4,586 | $297,950 | $90,875 | $207,075 |
| 2017 | $4,496 | $292,109 | $89,094 | $203,015 |
| 2016 | $4,425 | $286,383 | $87,348 | $199,035 |
| 2015 | $4,369 | $282,084 | $86,037 | $196,047 |
| 2014 | $4,261 | $276,559 | $84,352 | $192,207 |
Source: Public Records
Map
Nearby Homes
- 31337 Huron St
- 31353 Huron St
- 31598 Six Rivers Ct
- 31109 Shicali Ct
- 45733 Sierra Ct
- 45730 Hopactong St
- 31579 Mendocino Ct
- 45774 Hopactong St
- 31384 Pahuta St
- 31330 Eucalyptus Ct
- 45590 Basswood Ct
- 31605 Seastar Place
- 31752 Green Oak Way Unit 35
- 31012 Dulce Ct
- 31891 Domenoe Way
- 45575 Hawk Ct
- 45454 Seagull Way
- 45946 Clubhouse Dr
- 31312 Calle Cirros
- 45218 Via Vela
- 31249 Hiawatha Ct
- 31265 Hiawatha Ct
- 31286 Bocaw Cir
- 31294 Bocaw Cir
- 31273 Hiawatha Ct
- 31252 Hiawatha Ct
- 31302 Bocaw Cir
- 31244 Hiawatha Ct
- 31260 Hiawatha Ct
- 31281 Hiawatha Ct
- 45535 Piute St
- 45561 Piute St
- 45510 Piute St
- 45585 Piute St
- 31276 Hiawatha Ct
- 31268 Hiawatha Ct
- 31310 Bocaw Cir
- 45485 Piute St
- 45611 Piute St
- 31291 Bocaw Cir
Your Personal Tour Guide
Ask me questions while you tour the home.