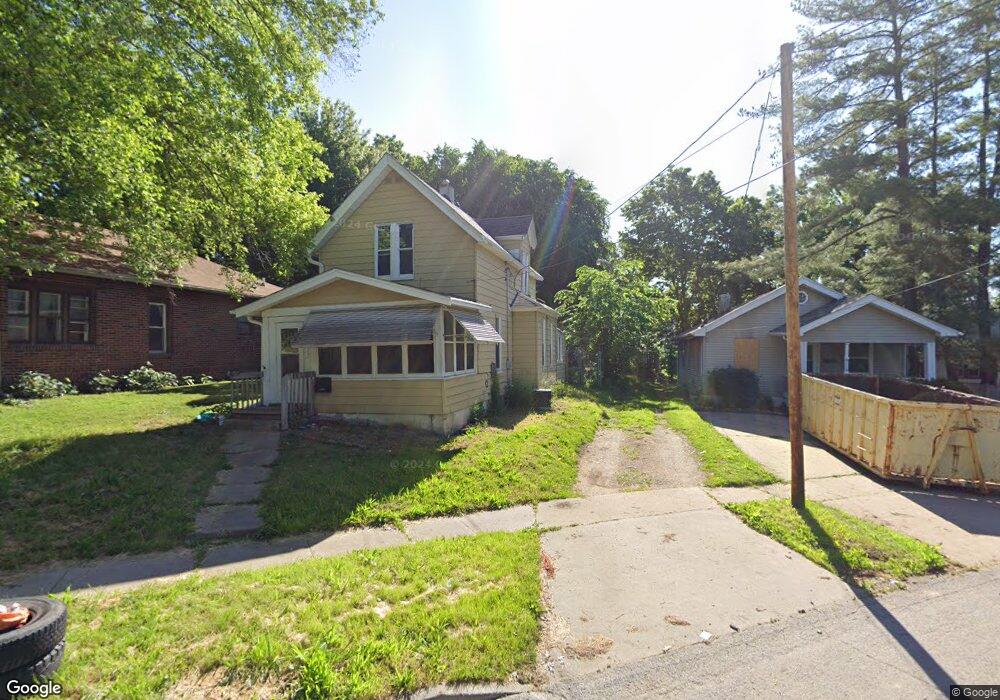
3127 8th St Des Moines, IA 50313
Oak Park NeighborhoodEstimated Value: $120,000 - $152,000
3
Beds
1
Bath
977
Sq Ft
$136/Sq Ft
Est. Value
About This Home
This home is located at 3127 8th St, Des Moines, IA 50313 and is currently estimated at $133,288, approximately $136 per square foot. 3127 8th St is a home located in Polk County with nearby schools including Oak Park Elementary School, Harding Middle School, and North High School.
Ownership History
Date
Name
Owned For
Owner Type
Purchase Details
Closed on
Jan 18, 2005
Sold by
Timelis Restorations Lc
Bought by
Waddell Timothy R and Buck Elisabeth C
Current Estimated Value
Purchase Details
Closed on
Jan 26, 1999
Sold by
Lemke Stacie
Bought by
Timelis Restorations Lc
Home Financials for this Owner
Home Financials are based on the most recent Mortgage that was taken out on this home.
Original Mortgage
$27,150
Interest Rate
6.81%
Purchase Details
Closed on
Feb 17, 1997
Sold by
Lemke Stacie
Bought by
Timelis Restorations
Create a Home Valuation Report for This Property
The Home Valuation Report is an in-depth analysis detailing your home's value as well as a comparison with similar homes in the area
Home Values in the Area
Average Home Value in this Area
Purchase History
| Date | Buyer | Sale Price | Title Company |
|---|---|---|---|
| Waddell Timothy R | -- | None Available | |
| Timelis Restorations Lc | $33,500 | -- | |
| Timelis Restorations | $34,000 | -- |
Source: Public Records
Mortgage History
| Date | Status | Borrower | Loan Amount |
|---|---|---|---|
| Previous Owner | Timelis Restorations Lc | $27,150 |
Source: Public Records
Tax History Compared to Growth
Tax History
| Year | Tax Paid | Tax Assessment Tax Assessment Total Assessment is a certain percentage of the fair market value that is determined by local assessors to be the total taxable value of land and additions on the property. | Land | Improvement |
|---|---|---|---|---|
| 2025 | $1,842 | $109,200 | $13,200 | $96,000 |
| 2024 | $1,842 | $93,600 | $11,400 | $82,200 |
| 2023 | $1,596 | $93,600 | $11,400 | $82,200 |
| 2022 | $1,584 | $67,700 | $9,900 | $57,800 |
| 2021 | $1,470 | $67,700 | $9,900 | $57,800 |
| 2020 | $1,526 | $58,900 | $8,600 | $50,300 |
| 2019 | $1,394 | $58,900 | $8,600 | $50,300 |
| 2018 | $1,380 | $51,900 | $7,500 | $44,400 |
| 2017 | $1,372 | $51,900 | $7,500 | $44,400 |
| 2016 | $1,336 | $50,700 | $7,300 | $43,400 |
| 2015 | $1,336 | $50,700 | $7,300 | $43,400 |
| 2014 | $1,384 | $52,100 | $7,500 | $44,600 |
Source: Public Records
Map
Nearby Homes